Grid View - A Faster, Smarter Way to Work with Salesforce Data
Powerful query, filtering, personalization, presentation and collaboration features
that delight users, maximize productivity and increase user adoption
Powerful query, filtering, personalization, presentation and collaboration features
that delight users, maximize productivity and increase user adoption
AppGrid enhances the Salesforce user experience by providing a highly efficient and intuitive interface for executing workflows. It is particularly well suited for mission-critical, line-of-business applications that are data-intensive and benefit from advanced query and filtering capabilities.
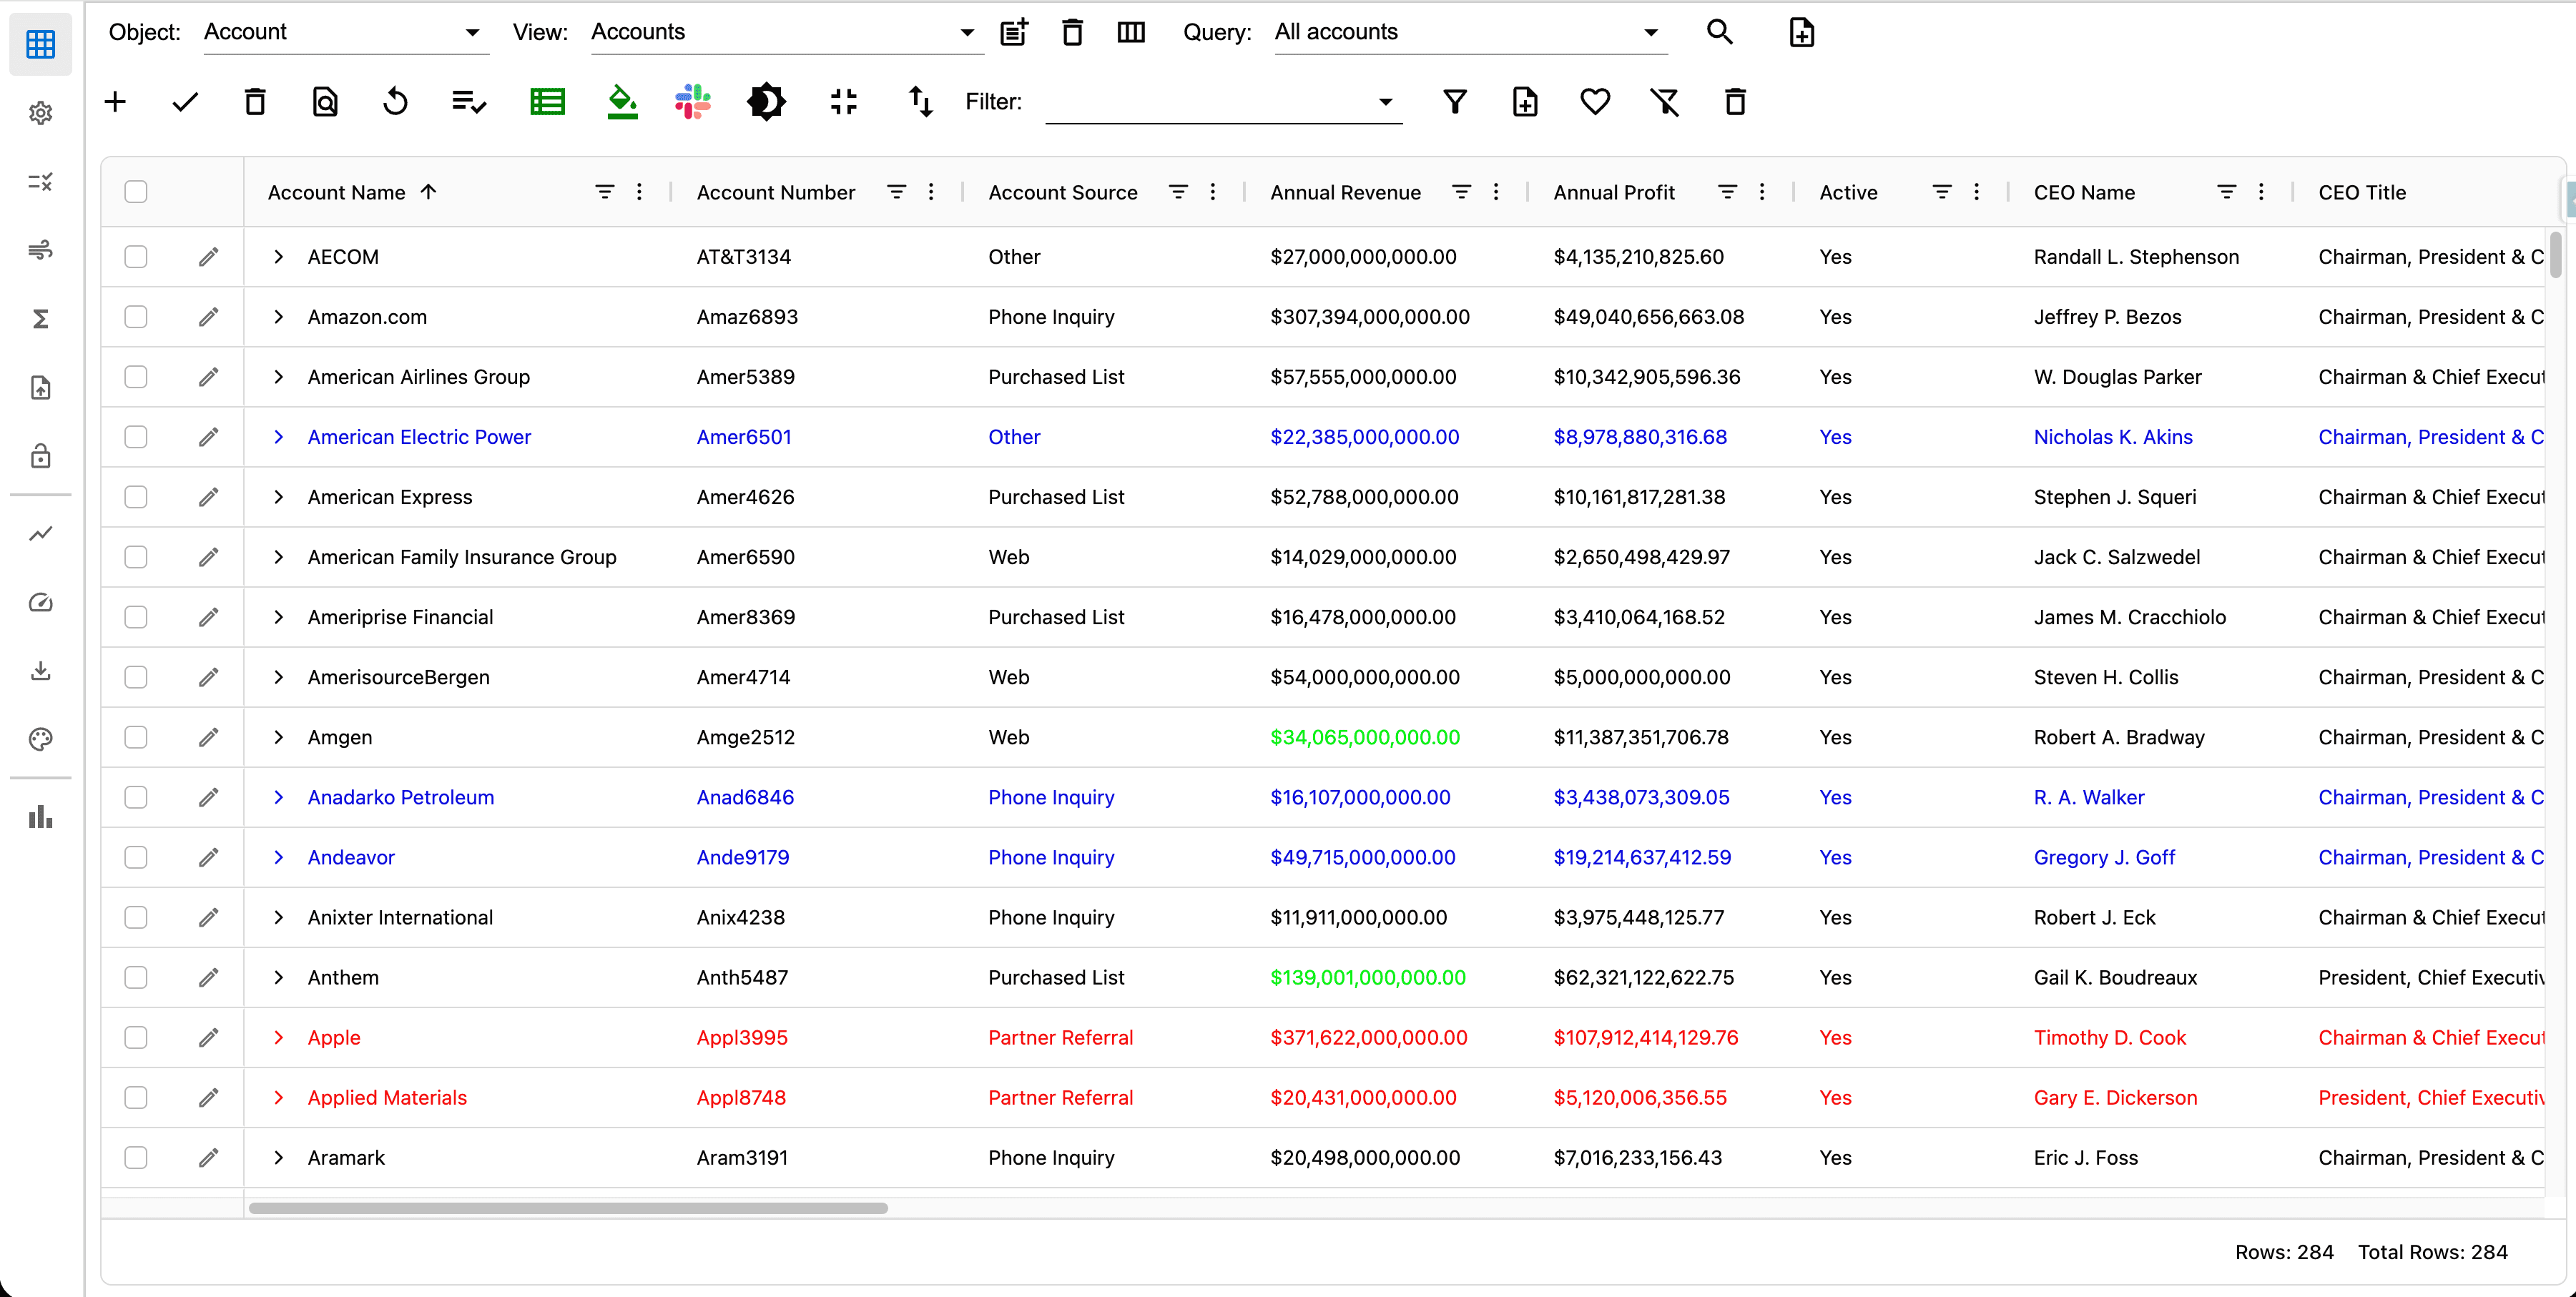
AppGrid is packed with personalization features that enable each user to customize their user experience to streamline their workflows and increase productivity. All main and related data is on a single page which eliminates the tedious navigation of the native Salesforce UI. The AppGrid Team Sharing feature increases collaboration by allowing users to share views and queries.
Easily load, view and update 100k records without pagination! Our powerful query and row/column virtualization technology makes that possible. The query wizard allows users to easily create and execute complex queries that include parent and child relationships. For example, you might want to query all Opportunities that have not had a certain type of Activity in the last month. This capability adds tremendous intelligence to your searches and surfaces records that would be otherwise buried or require scrolling through unneeded data to find the records needed for your workflow.
The filter wizard enables multi-column filter expressions to be created that also eliminate scrolling through un-needed data. The row & column formatting wizard turns data into information. Visualize your data with our enterprise graphics capabilities. Executives will like our new dashboard feature.
Sales and support managers will love our new Approval process view. Marketeers will like our lead conversion wizard that supports bulk conversions and fuzzy matching. Sales ops will see huge productivity gains using our Ownership conversion wizard that supports bulk operations and child relations - ideal for Account reassignments.
AppGrid provides 5 types of views (list, group, pivot, tree-grid and time-series grid) that are designed to optimize different types of workflows. Click the Views menu and read more about how these views can accelerate your business processes.
Our Excel import wizard makes it easy for business users to migrate data from external sources to Salesforce without the expense and learning curve of using third-party integration tools.
And for those who prefer dark mode, we now support that as well!
AppGrid now provides an api that uses Lightning Message Service to allow other LWC components to send commands to AppGrid. This api opens up many possible use cases to create custom bespoke apps. For example, one could imagine to have a map component on your AppGrid page that would allow the user to select a location and have AppGrid display the corresponding records. Another use case could display a calendar component where we want AppGrid to display records that contain a specific date value from some SObject like Shipping. See our blog post for more details.
Let's take a tour of the AppGrid features and provide a detailed understanding of how to use the app. To demonstrate the dark mode feature of AppGrid, some of images below will be displayed in dark mode.
Creating the Lightning page
AppGrid is a Lightning Web Component. To get started, you will need to create a Lightning Web Page or a Lighting tab. See our blog post for more details on which to choose. AppGrid can be used by itself or combined with other LWC components. If using the latter, we recommend that the page section which contains the AppGrid LWC component be no less than 1000px width and height.
AppGrid is responsive and will adjust it's layout to accommodate the size provided to it by the Lightning page.
Setting object preferences
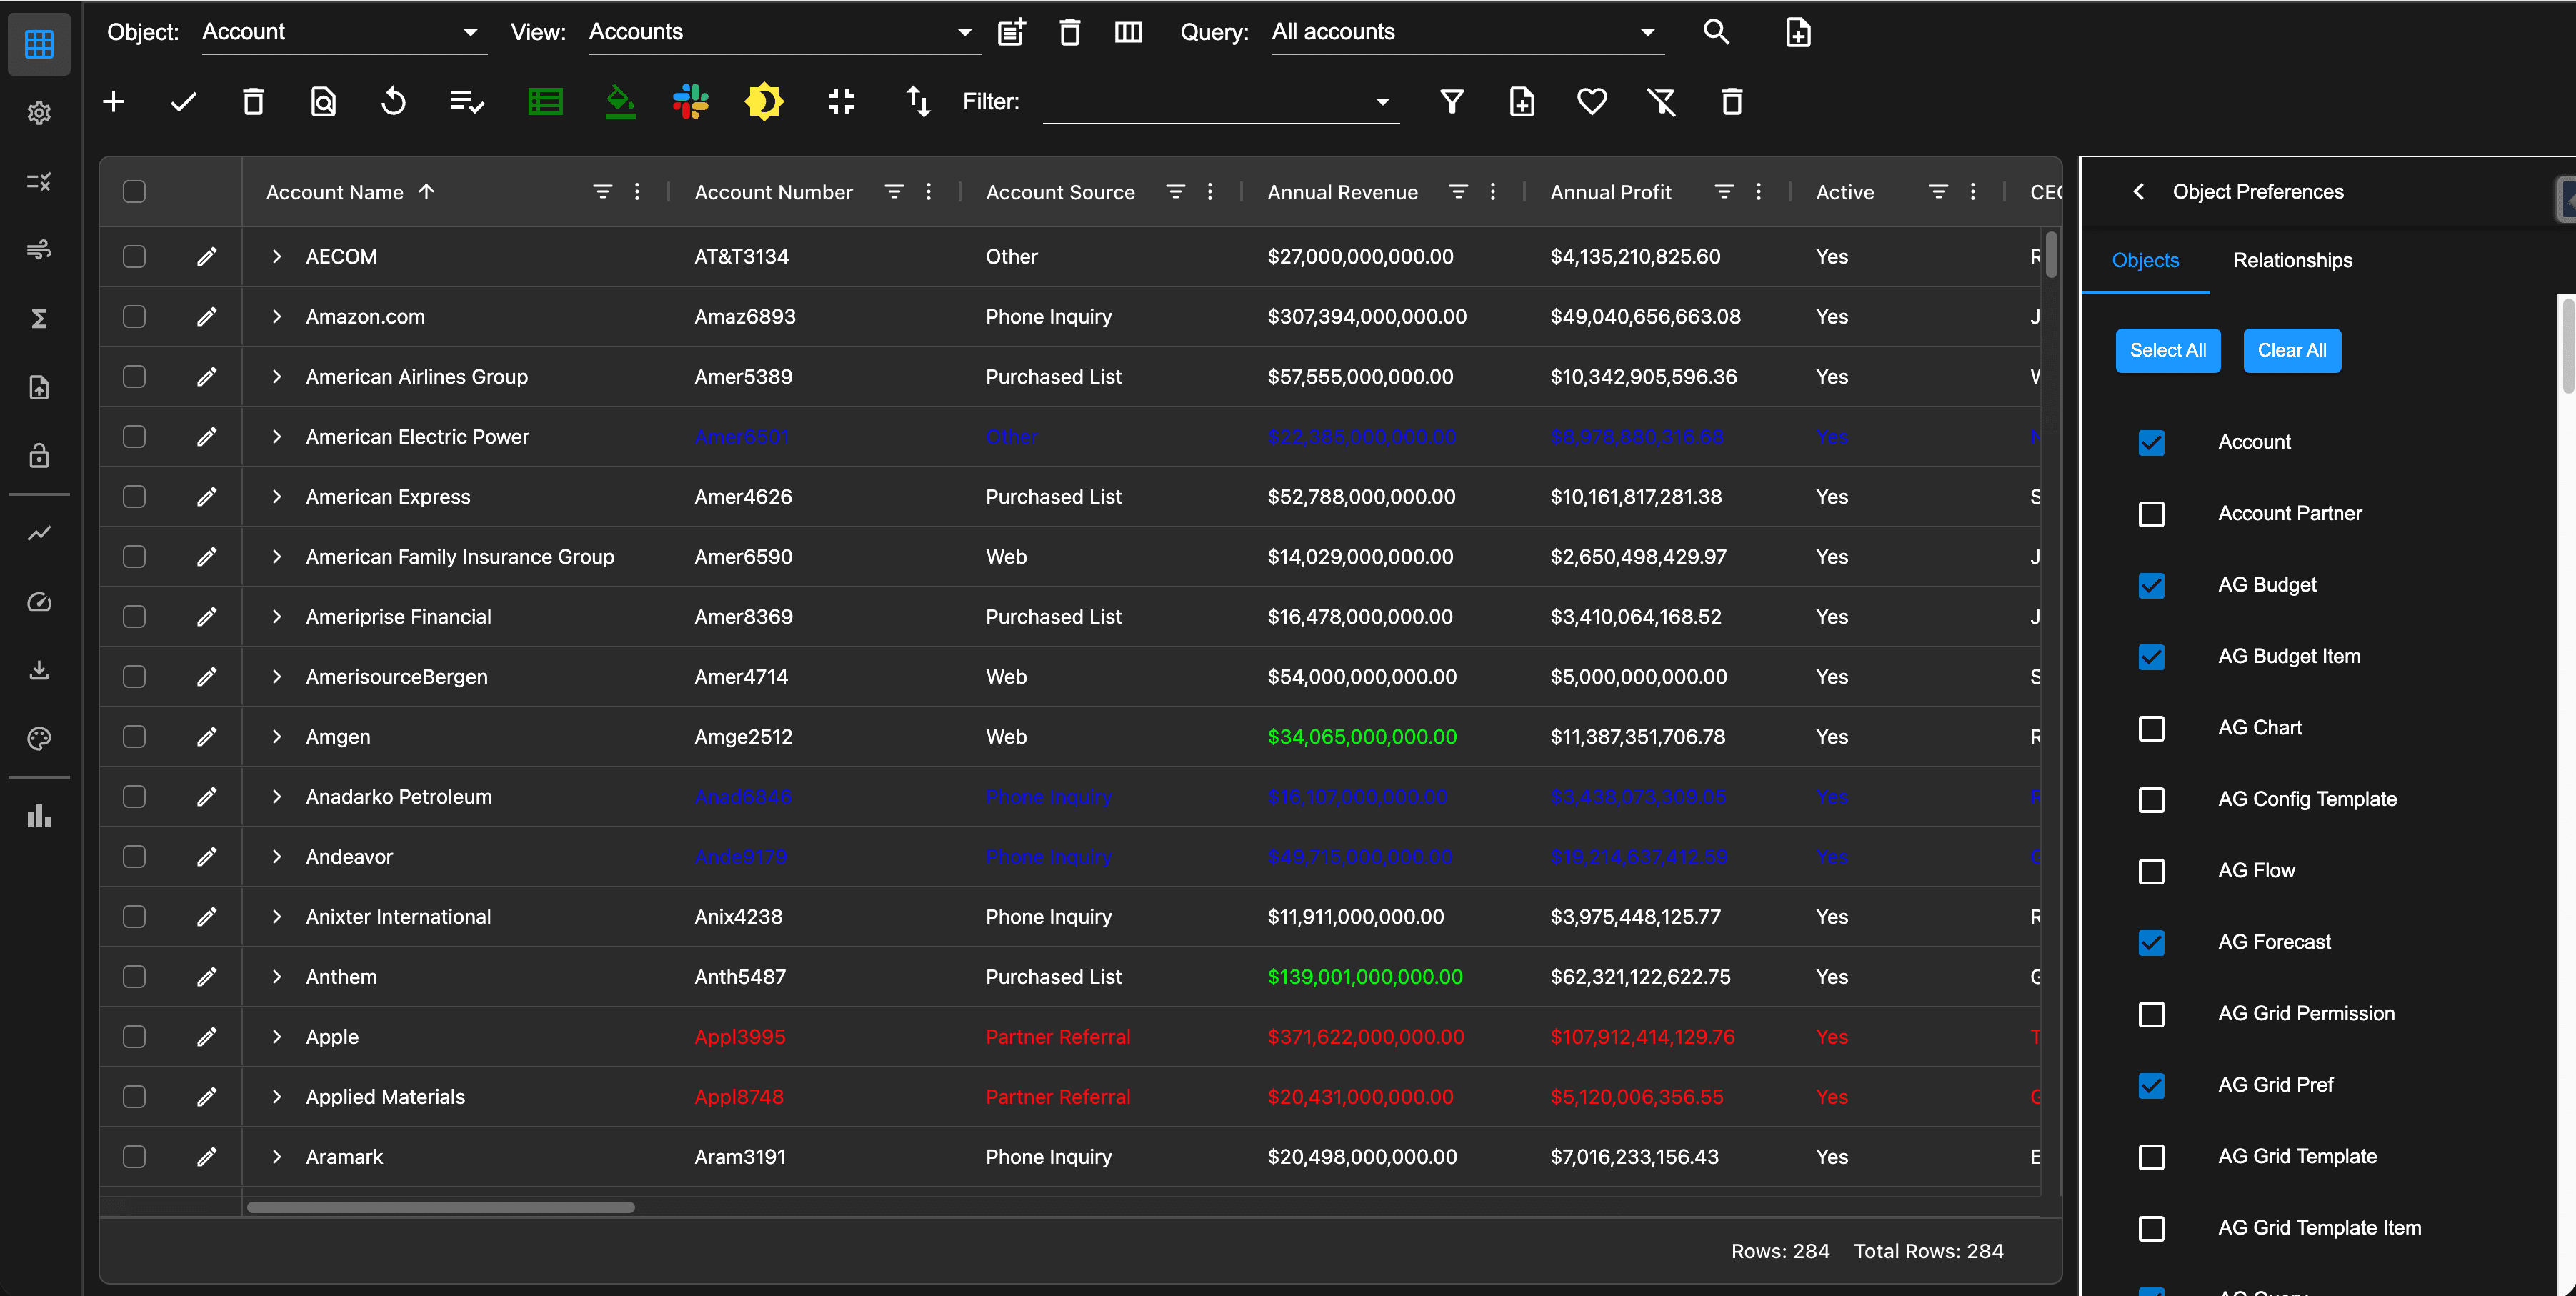
For the best user experience, we recommend that each user define what objects (and relationships) they wish to see in the grid toolbar object selector (and the subgrid relations selector). To open the object preferences wizard, click the ellipse button in the toolbar and select Objects from the dropdown menu. In the preferences panel, select the Objects tab. Check the objects you will use frequently in your workflows and uncheck the rest. The object selector will now allow you to navigate between your preferred objects.
Setting relation preferences
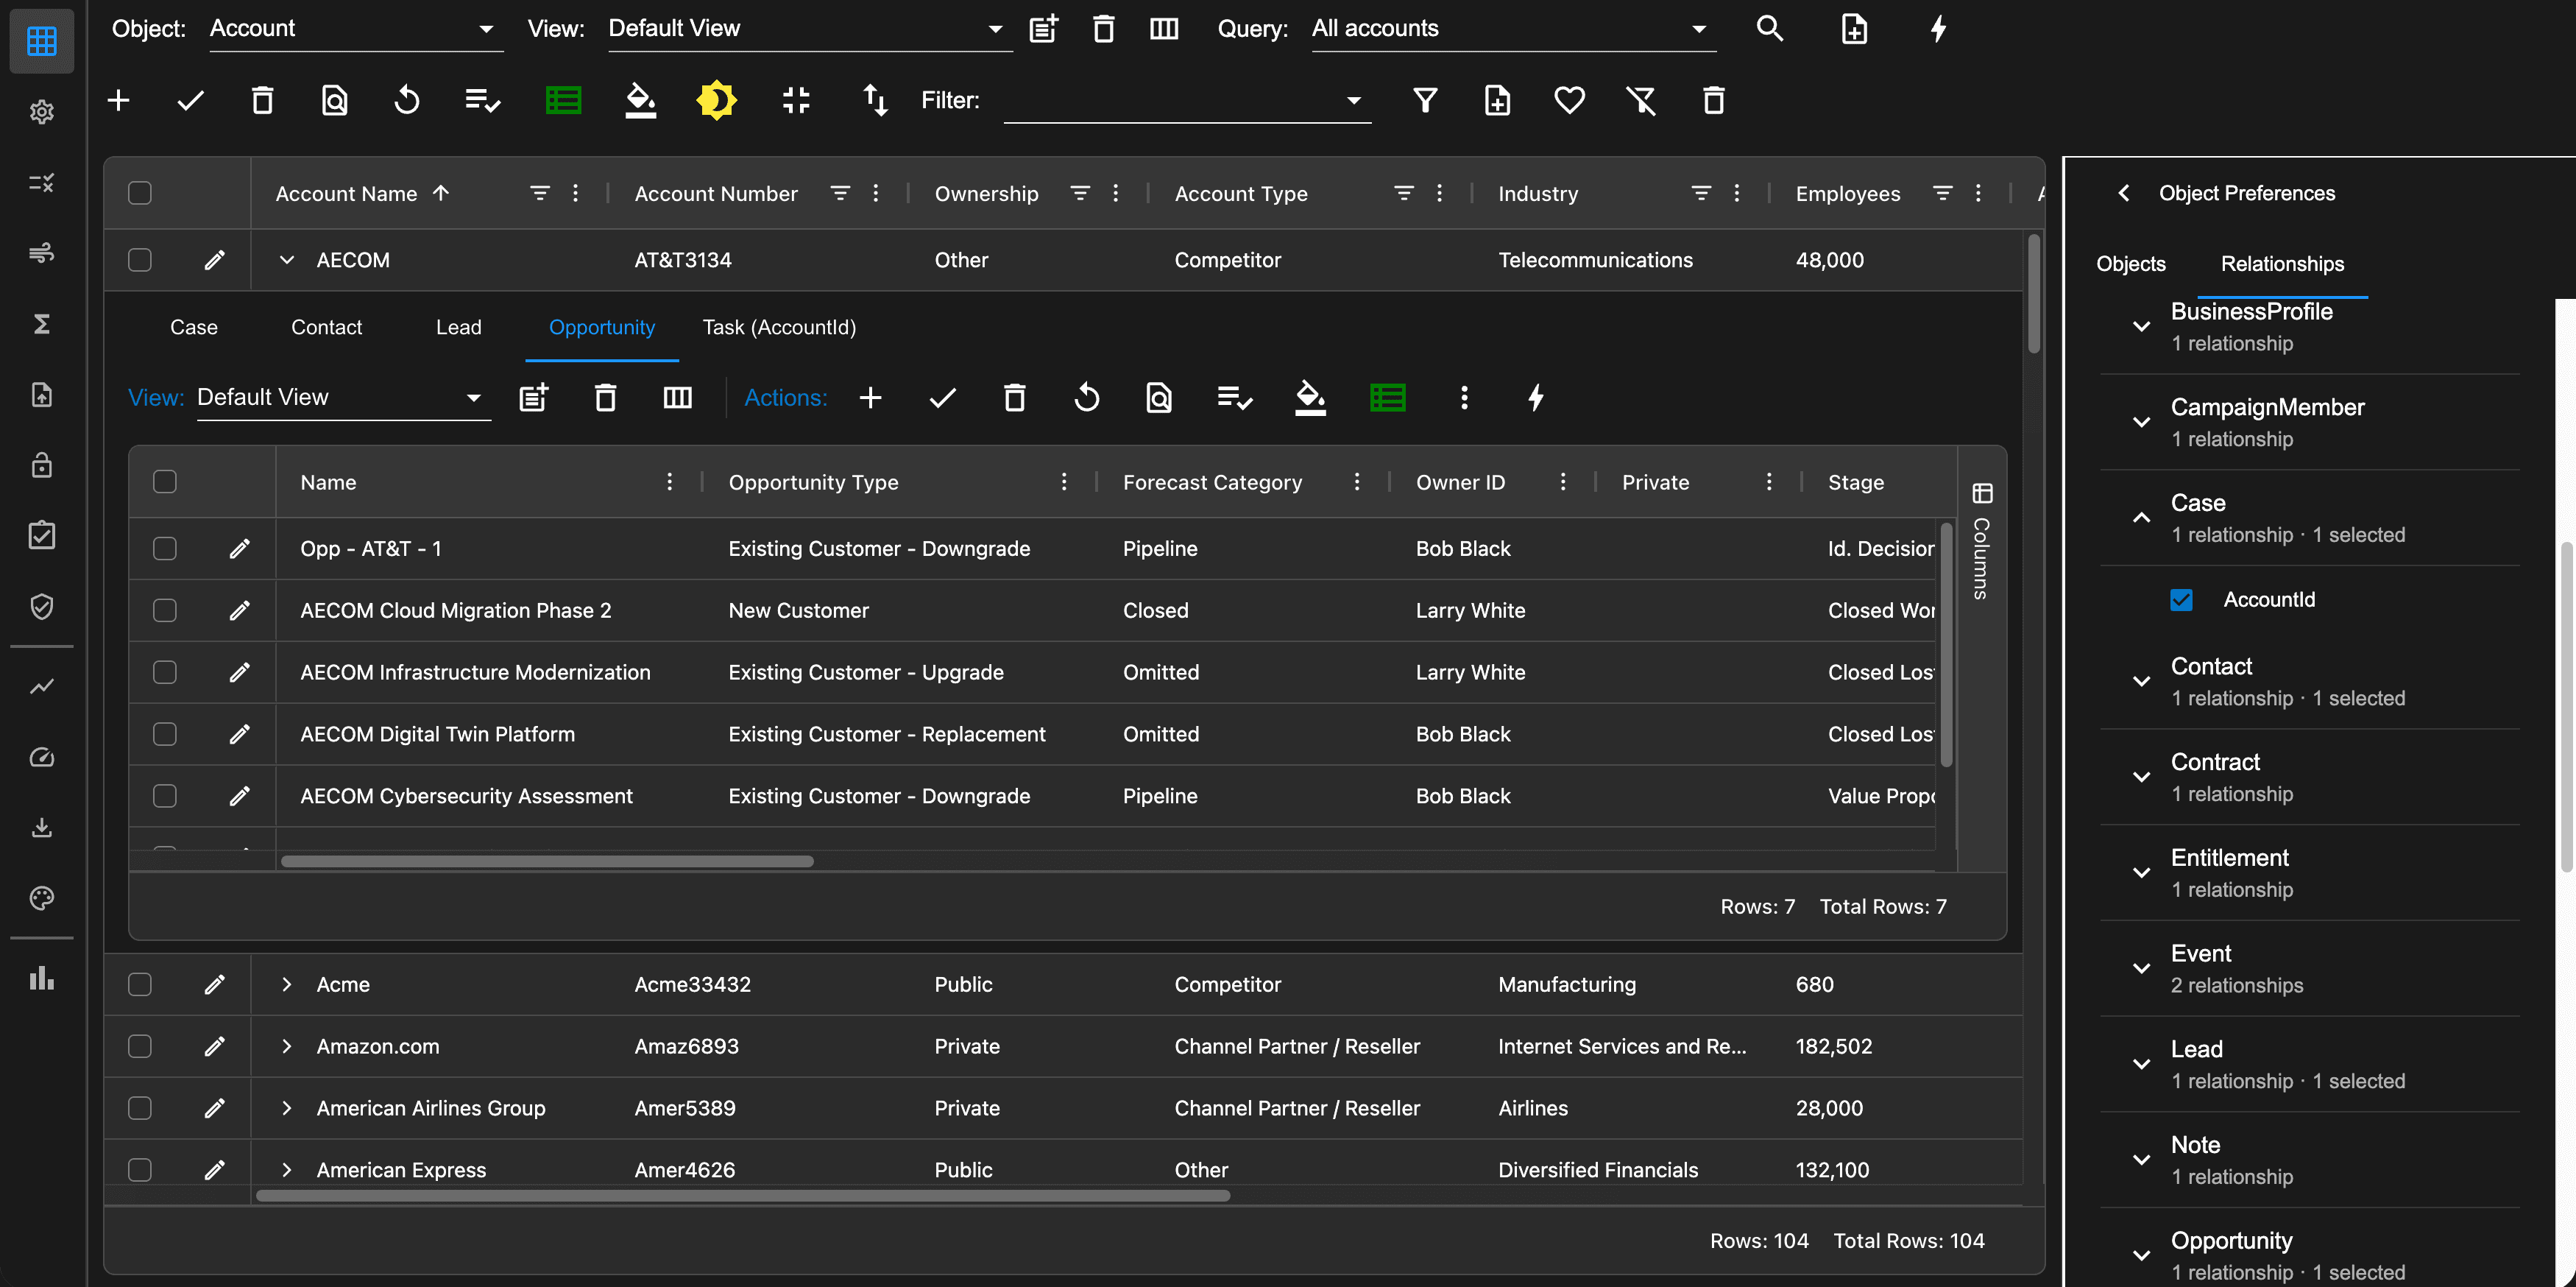
Relation preferences are used to define what subgrids are displayed when you expand a grid row. The relation preferences wizard is context sensitive to the current selected object. For example, if we currently viewing Accounts then the relation preferences wizard will allow us to define those preferences. To open the relation preferences wizard, click the ellipse button in the toolbar and select Objects from the dropdown menu. Click the Relationships tab. In this example, we will be viewing the Account relationships. Check the relationships you will use frequently in your workflows and uncheck the rest.
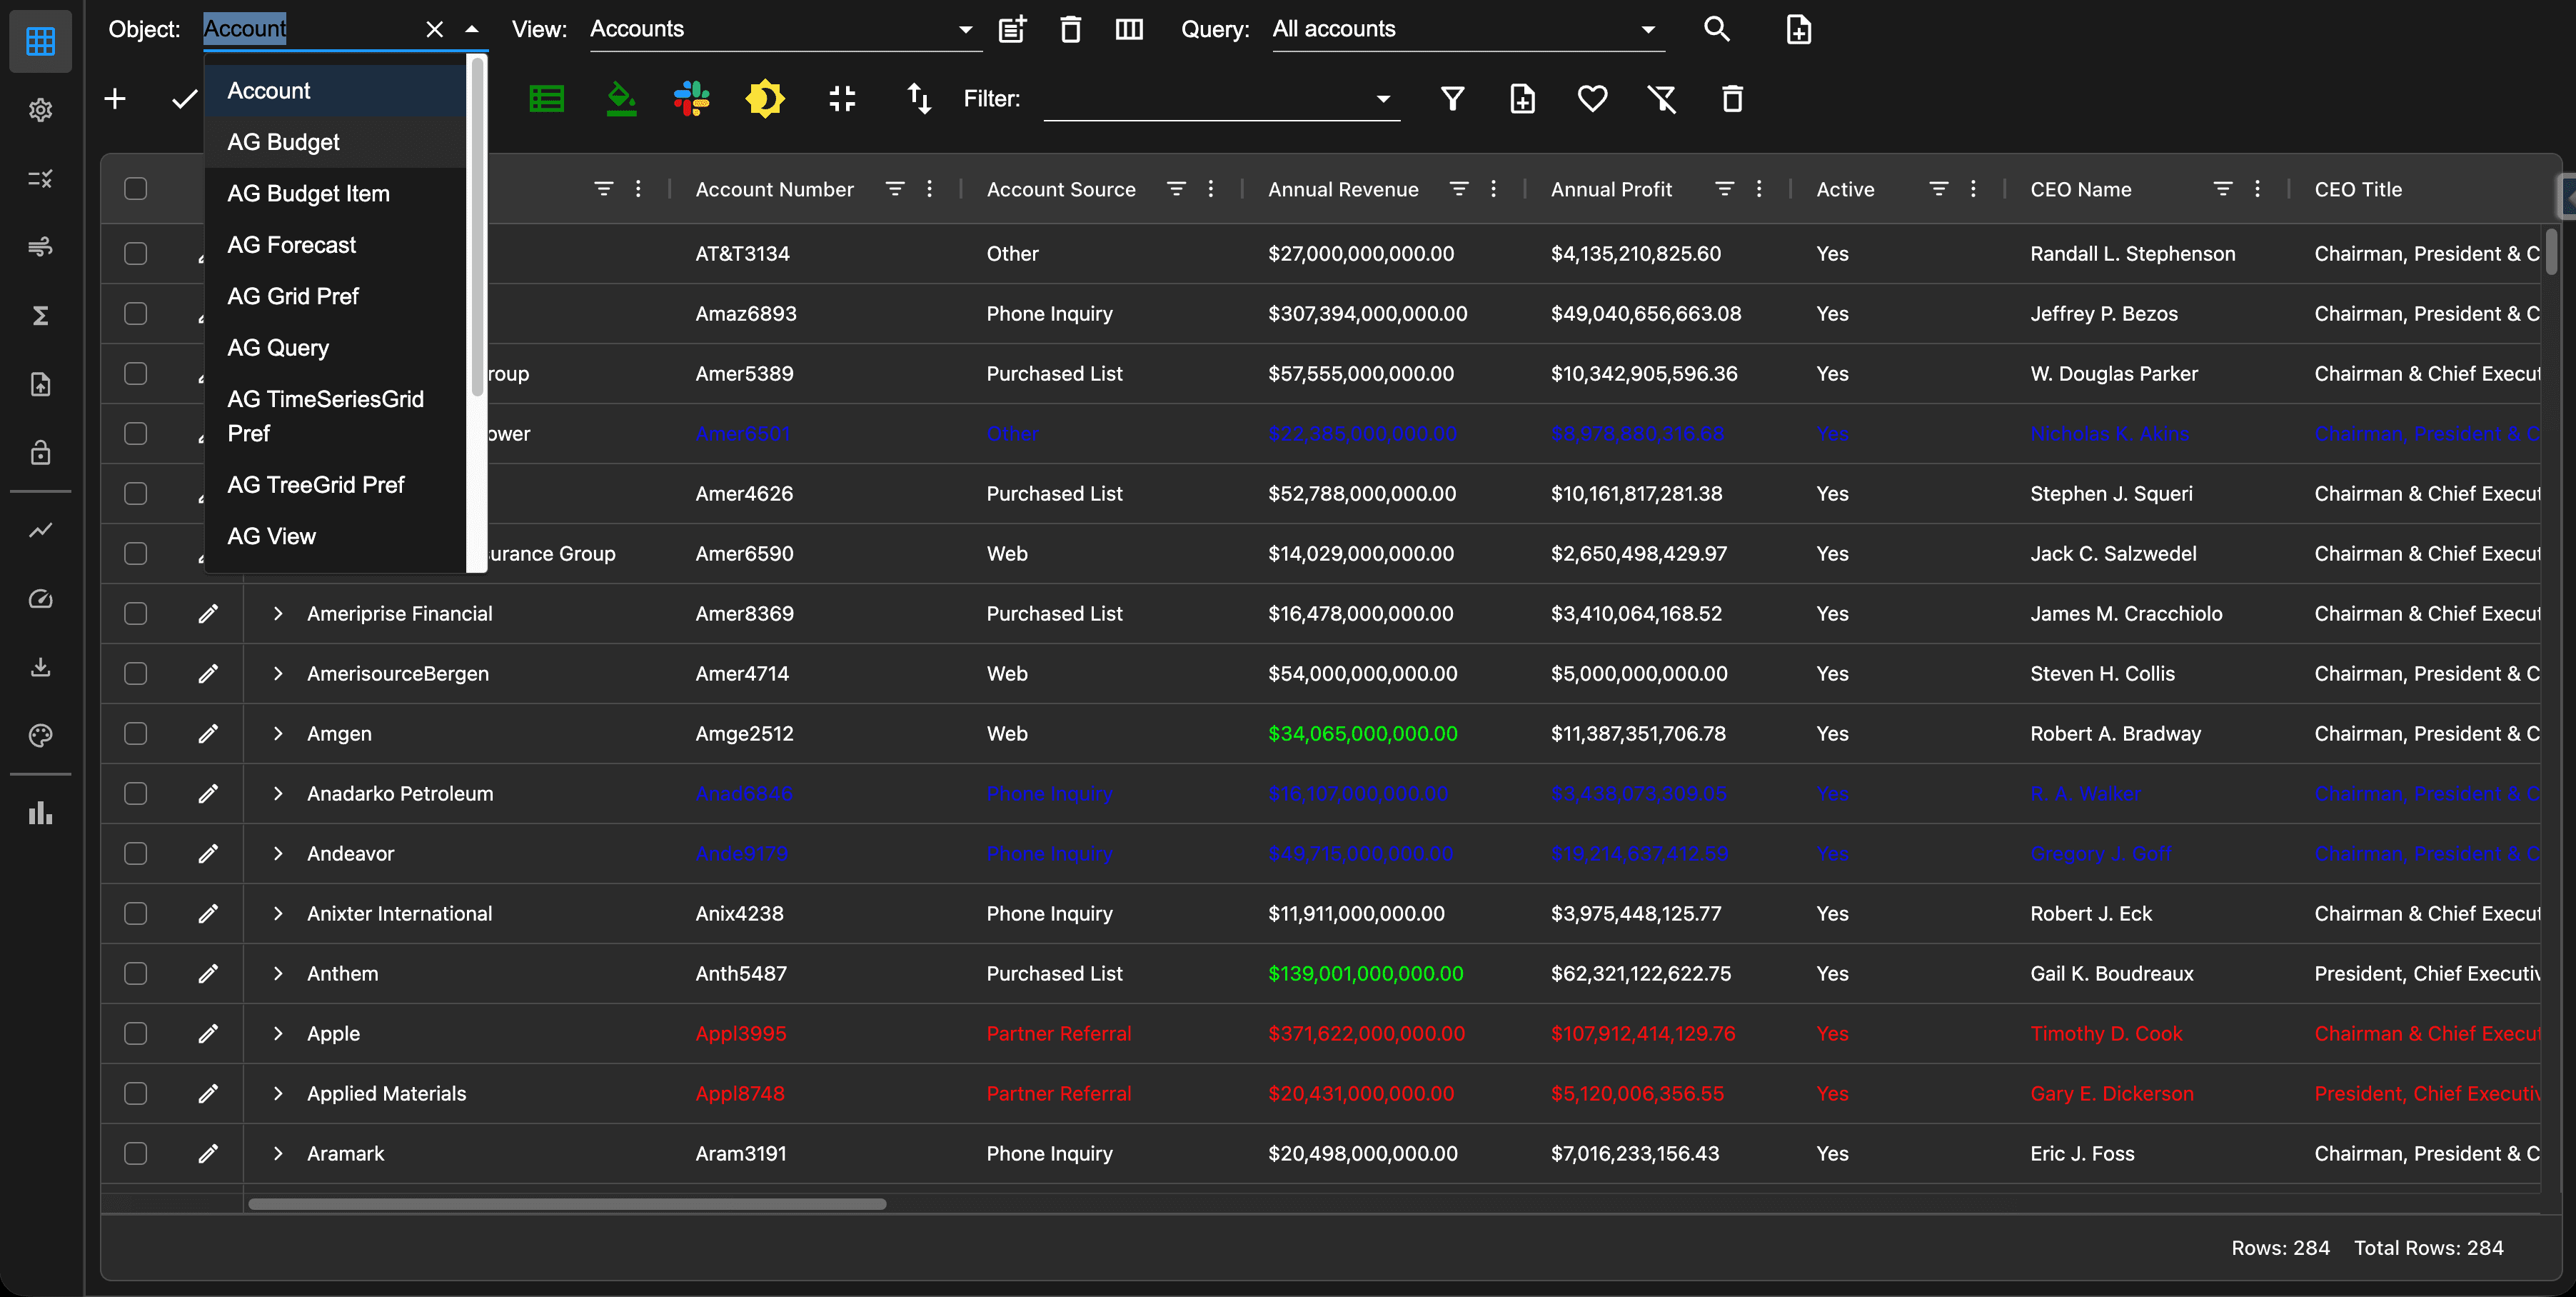
Selecting objects
Click the grid toolbar object selector and choose an object you wish to work with. AppGrid will load the views, queries, row & column format preferences, calculated columns and object flows that have been previously defined for that object. AppGrid will auto-select the last view and query used and the grid will display the selected view and query data.
Selecting views
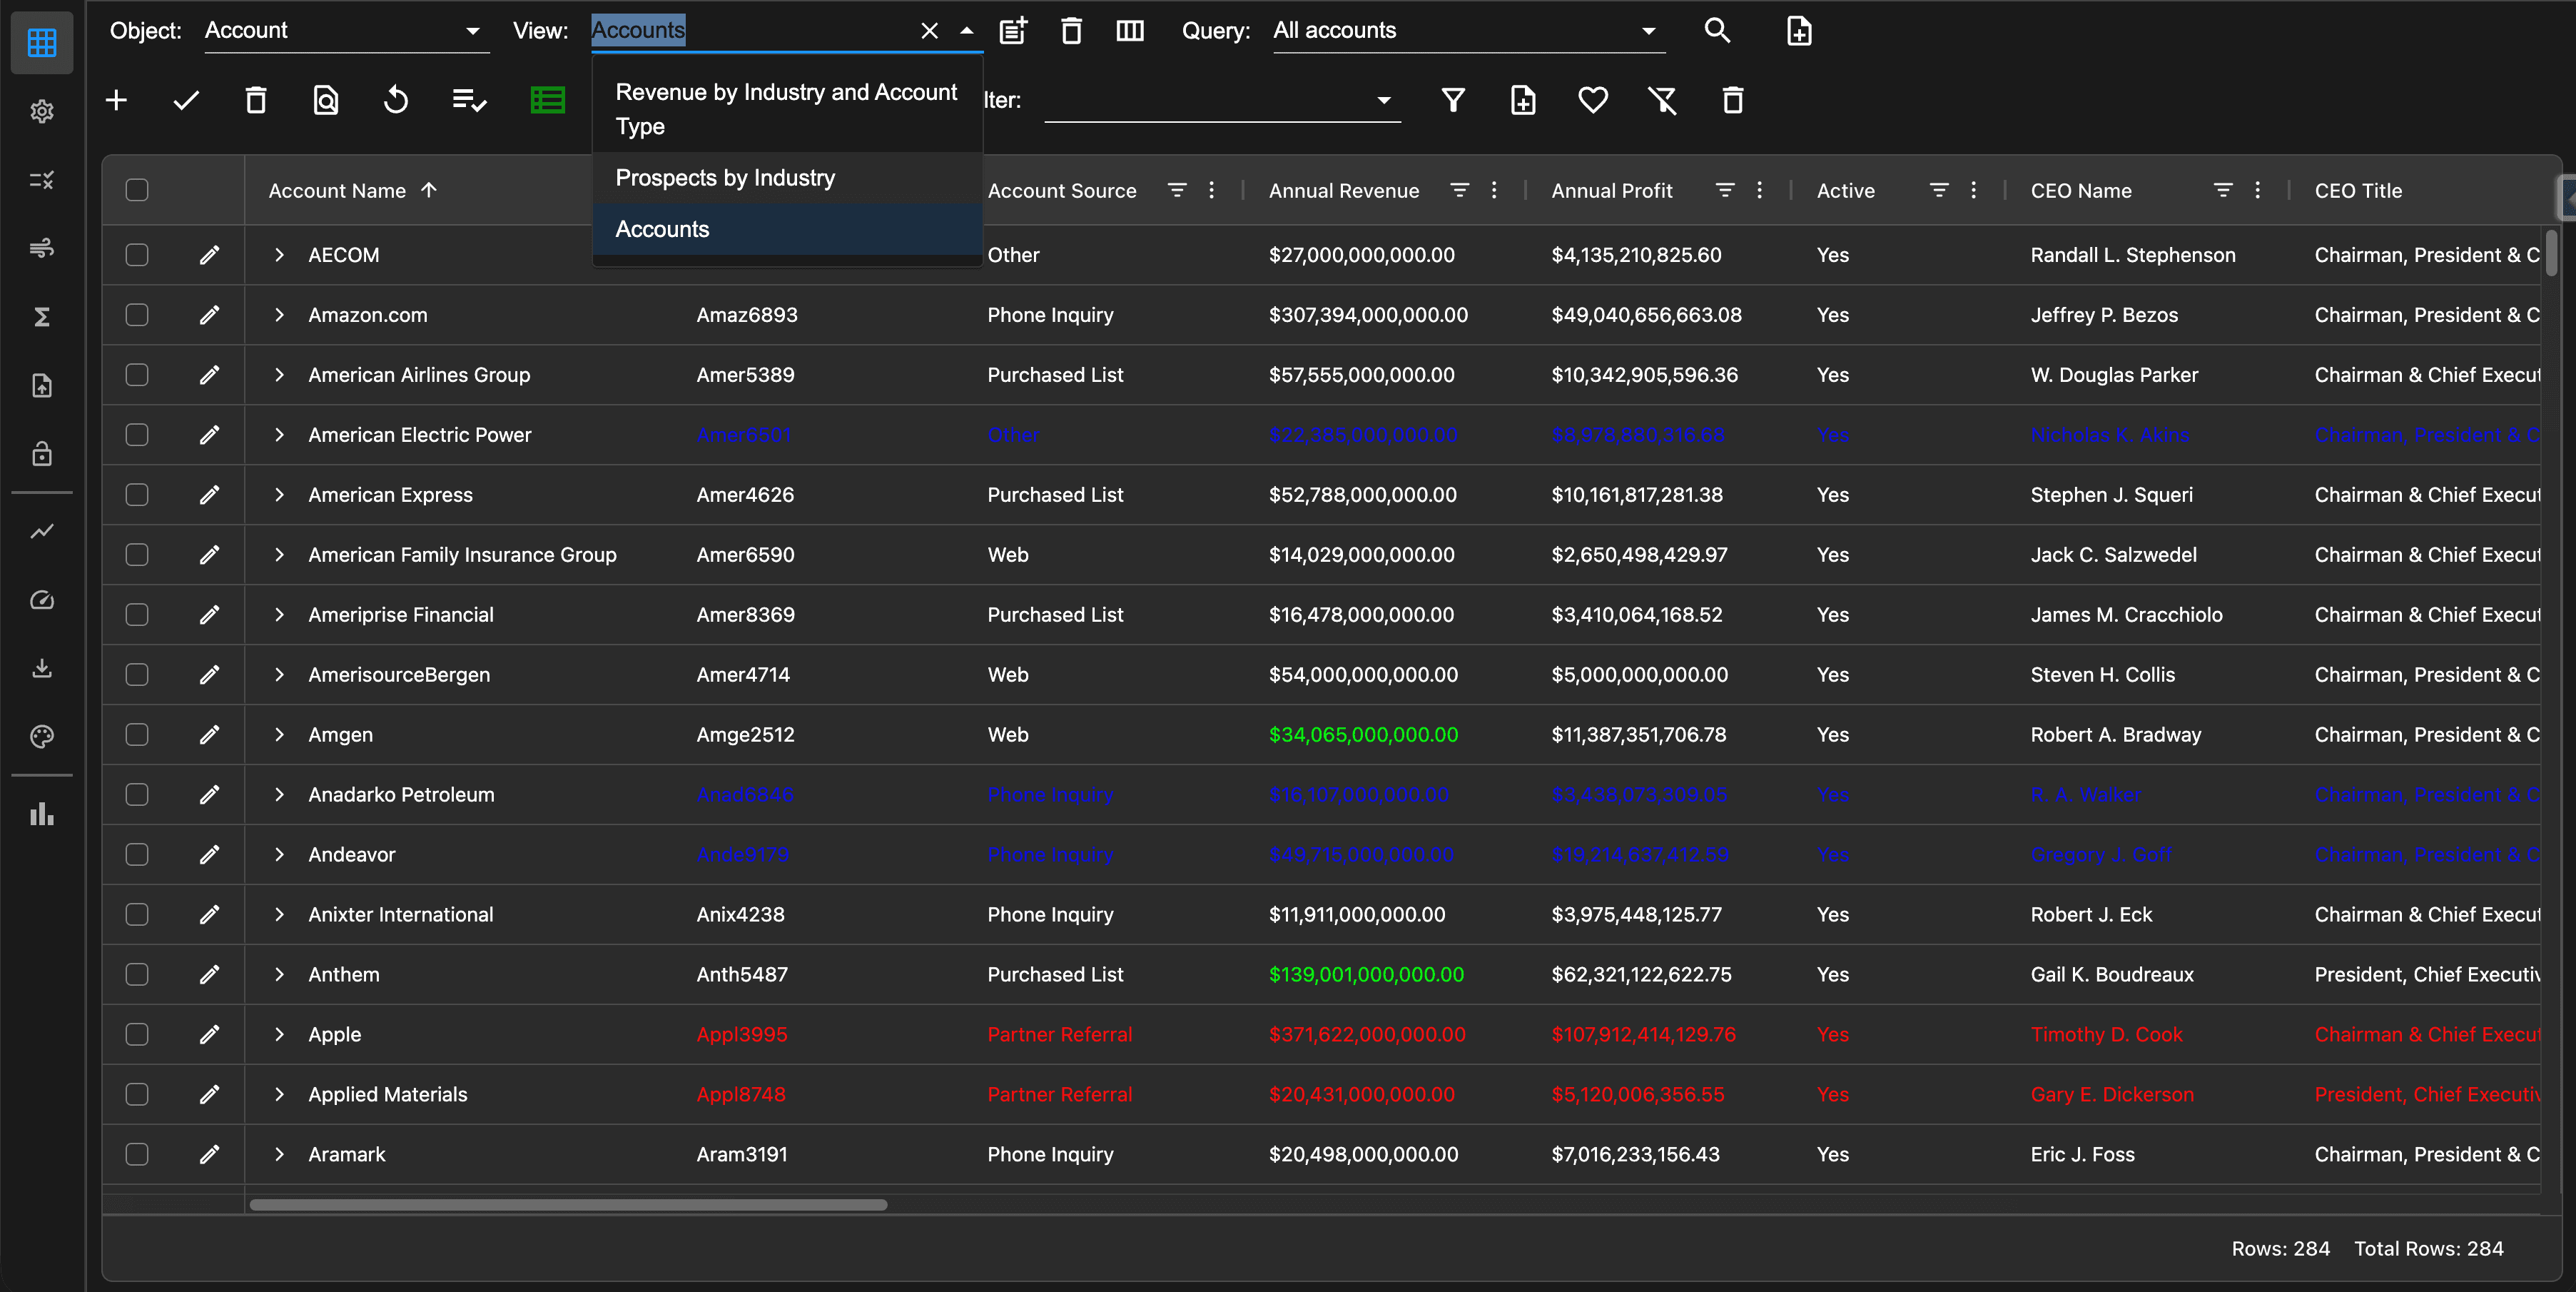
For each object, AppGrid allows you to create multiple views of various types, including a list view, grouped view, pivot view, treeGrid view and timeSeries view. If no views have been previously defined when you select a given object, AppGrid will create a default list view automatically. To change the current view, select the desired view from the view selector. To create a new view, click the column manager button in the grid toolbar. The column manager wizard will open.
Selecting queries
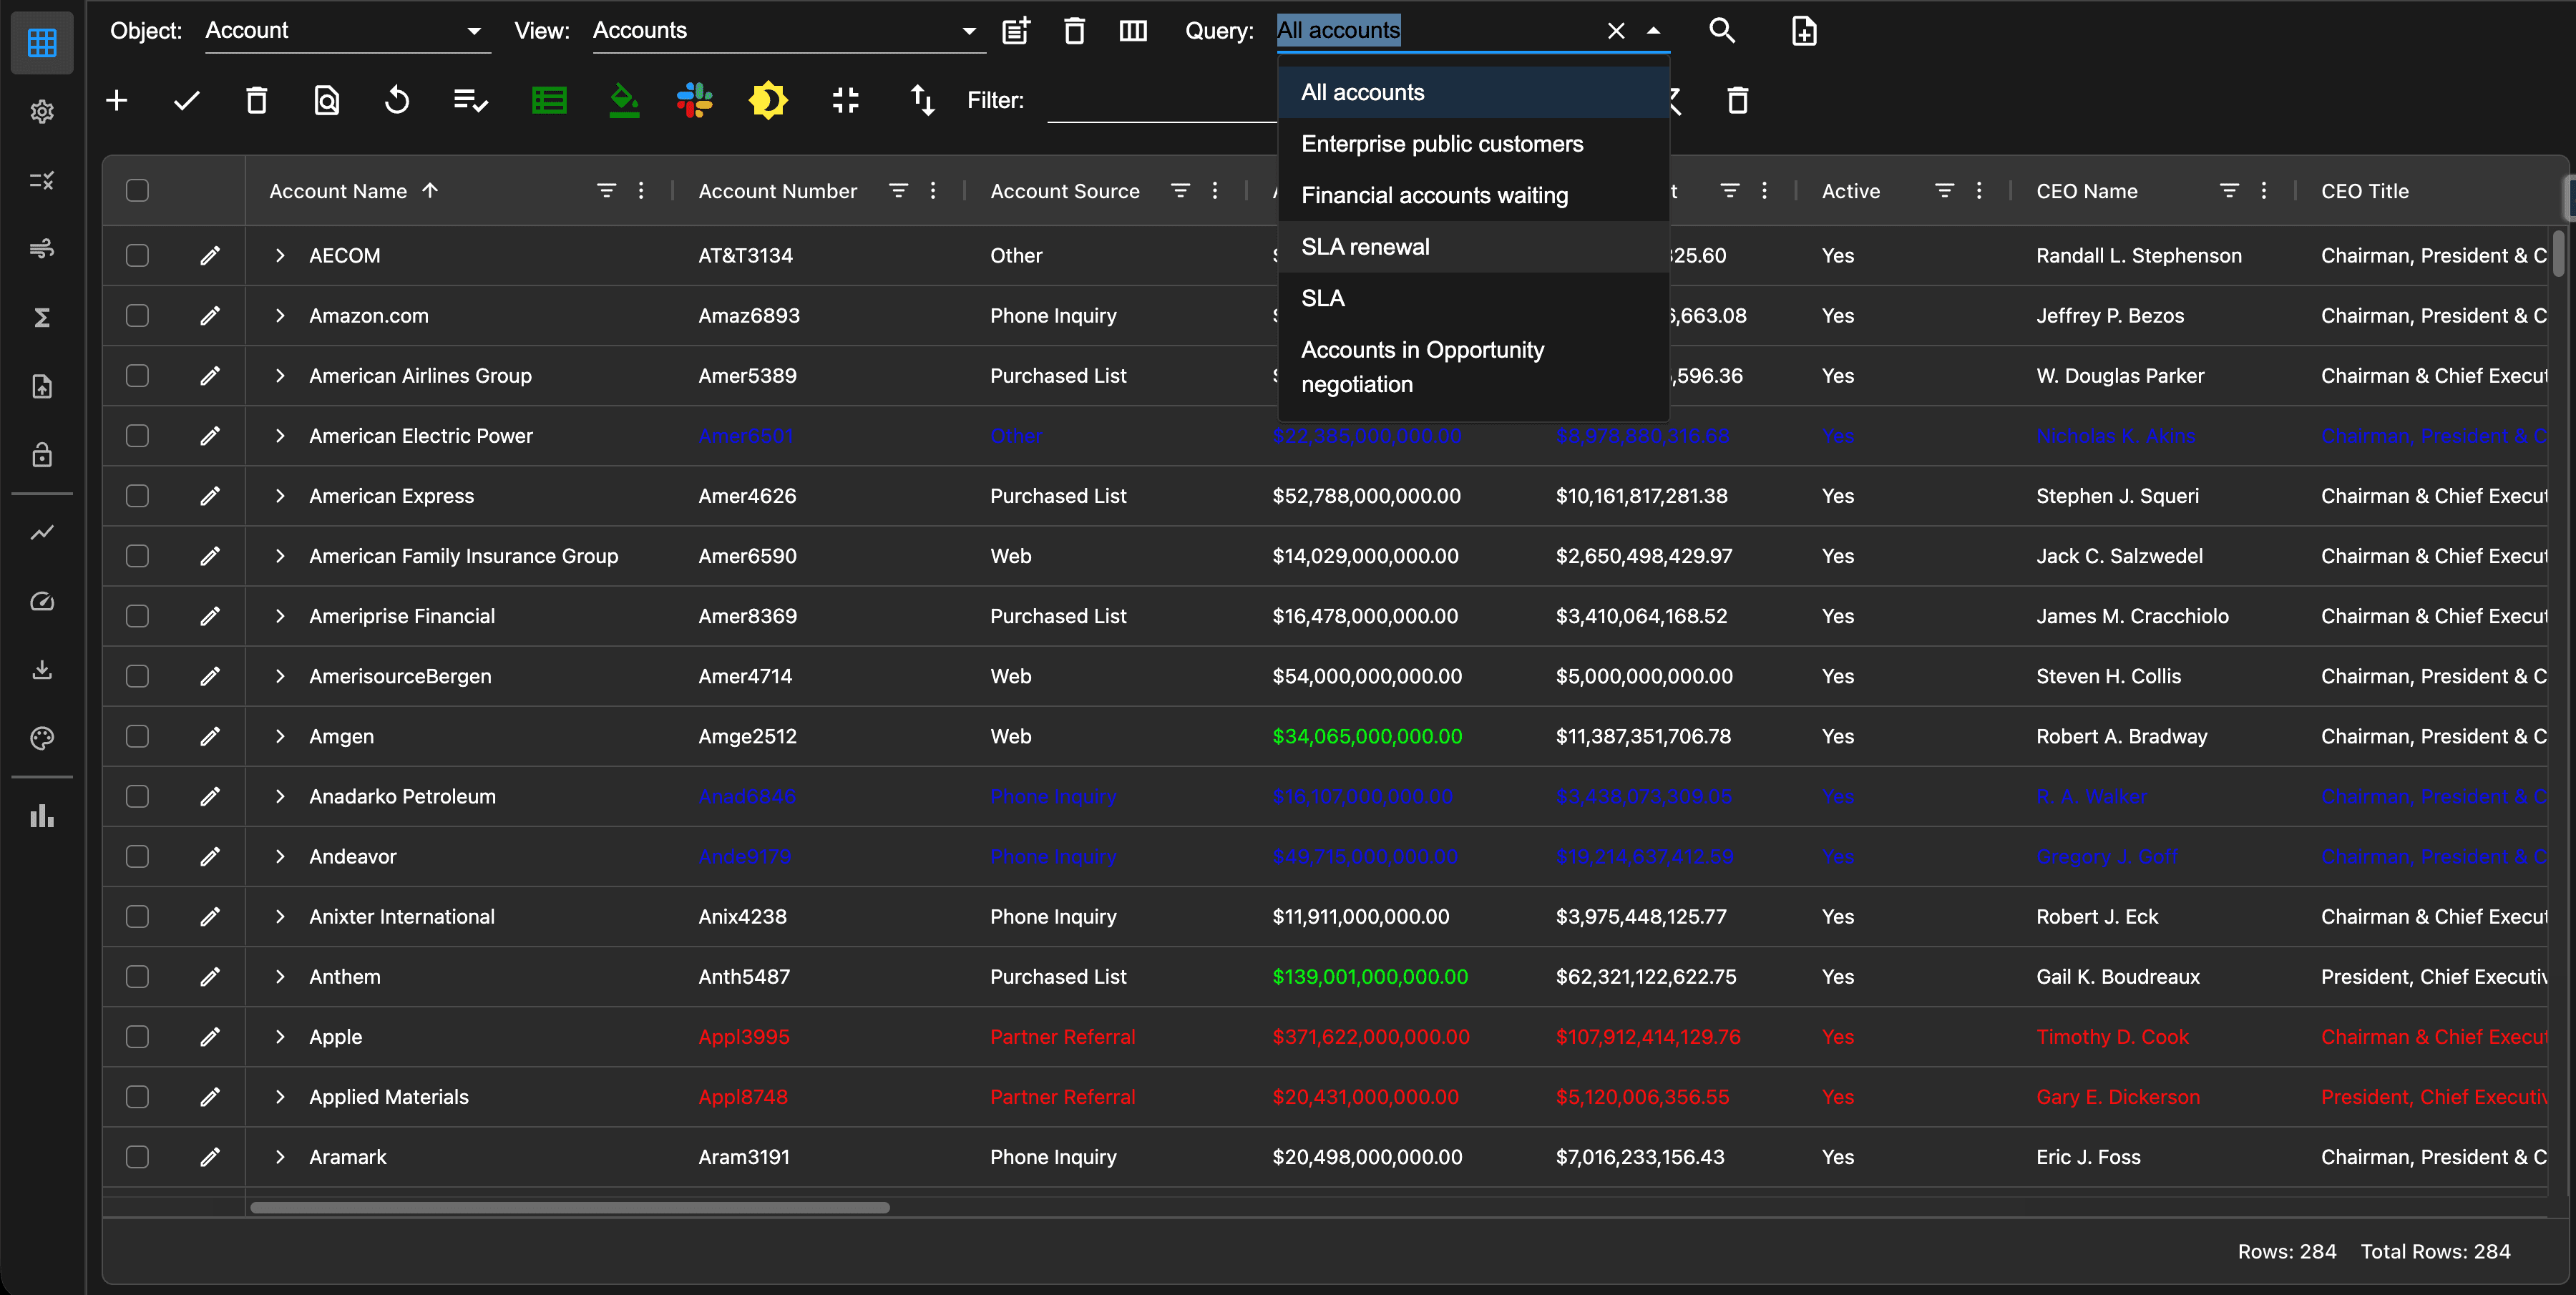
For each object, AppGrid allows you to create multiple queries. If no queries have been previously defined when you select a given object, AppGrid will display a notification with a quick link to open the query wizard. When you select an object, AppGrid will load the previously defined queries into the query selector. To change the current query, select the desired query from the query selector. To create a new query, click the query wizard button in the grid toolbar. The query wizard will open.
Using column filters
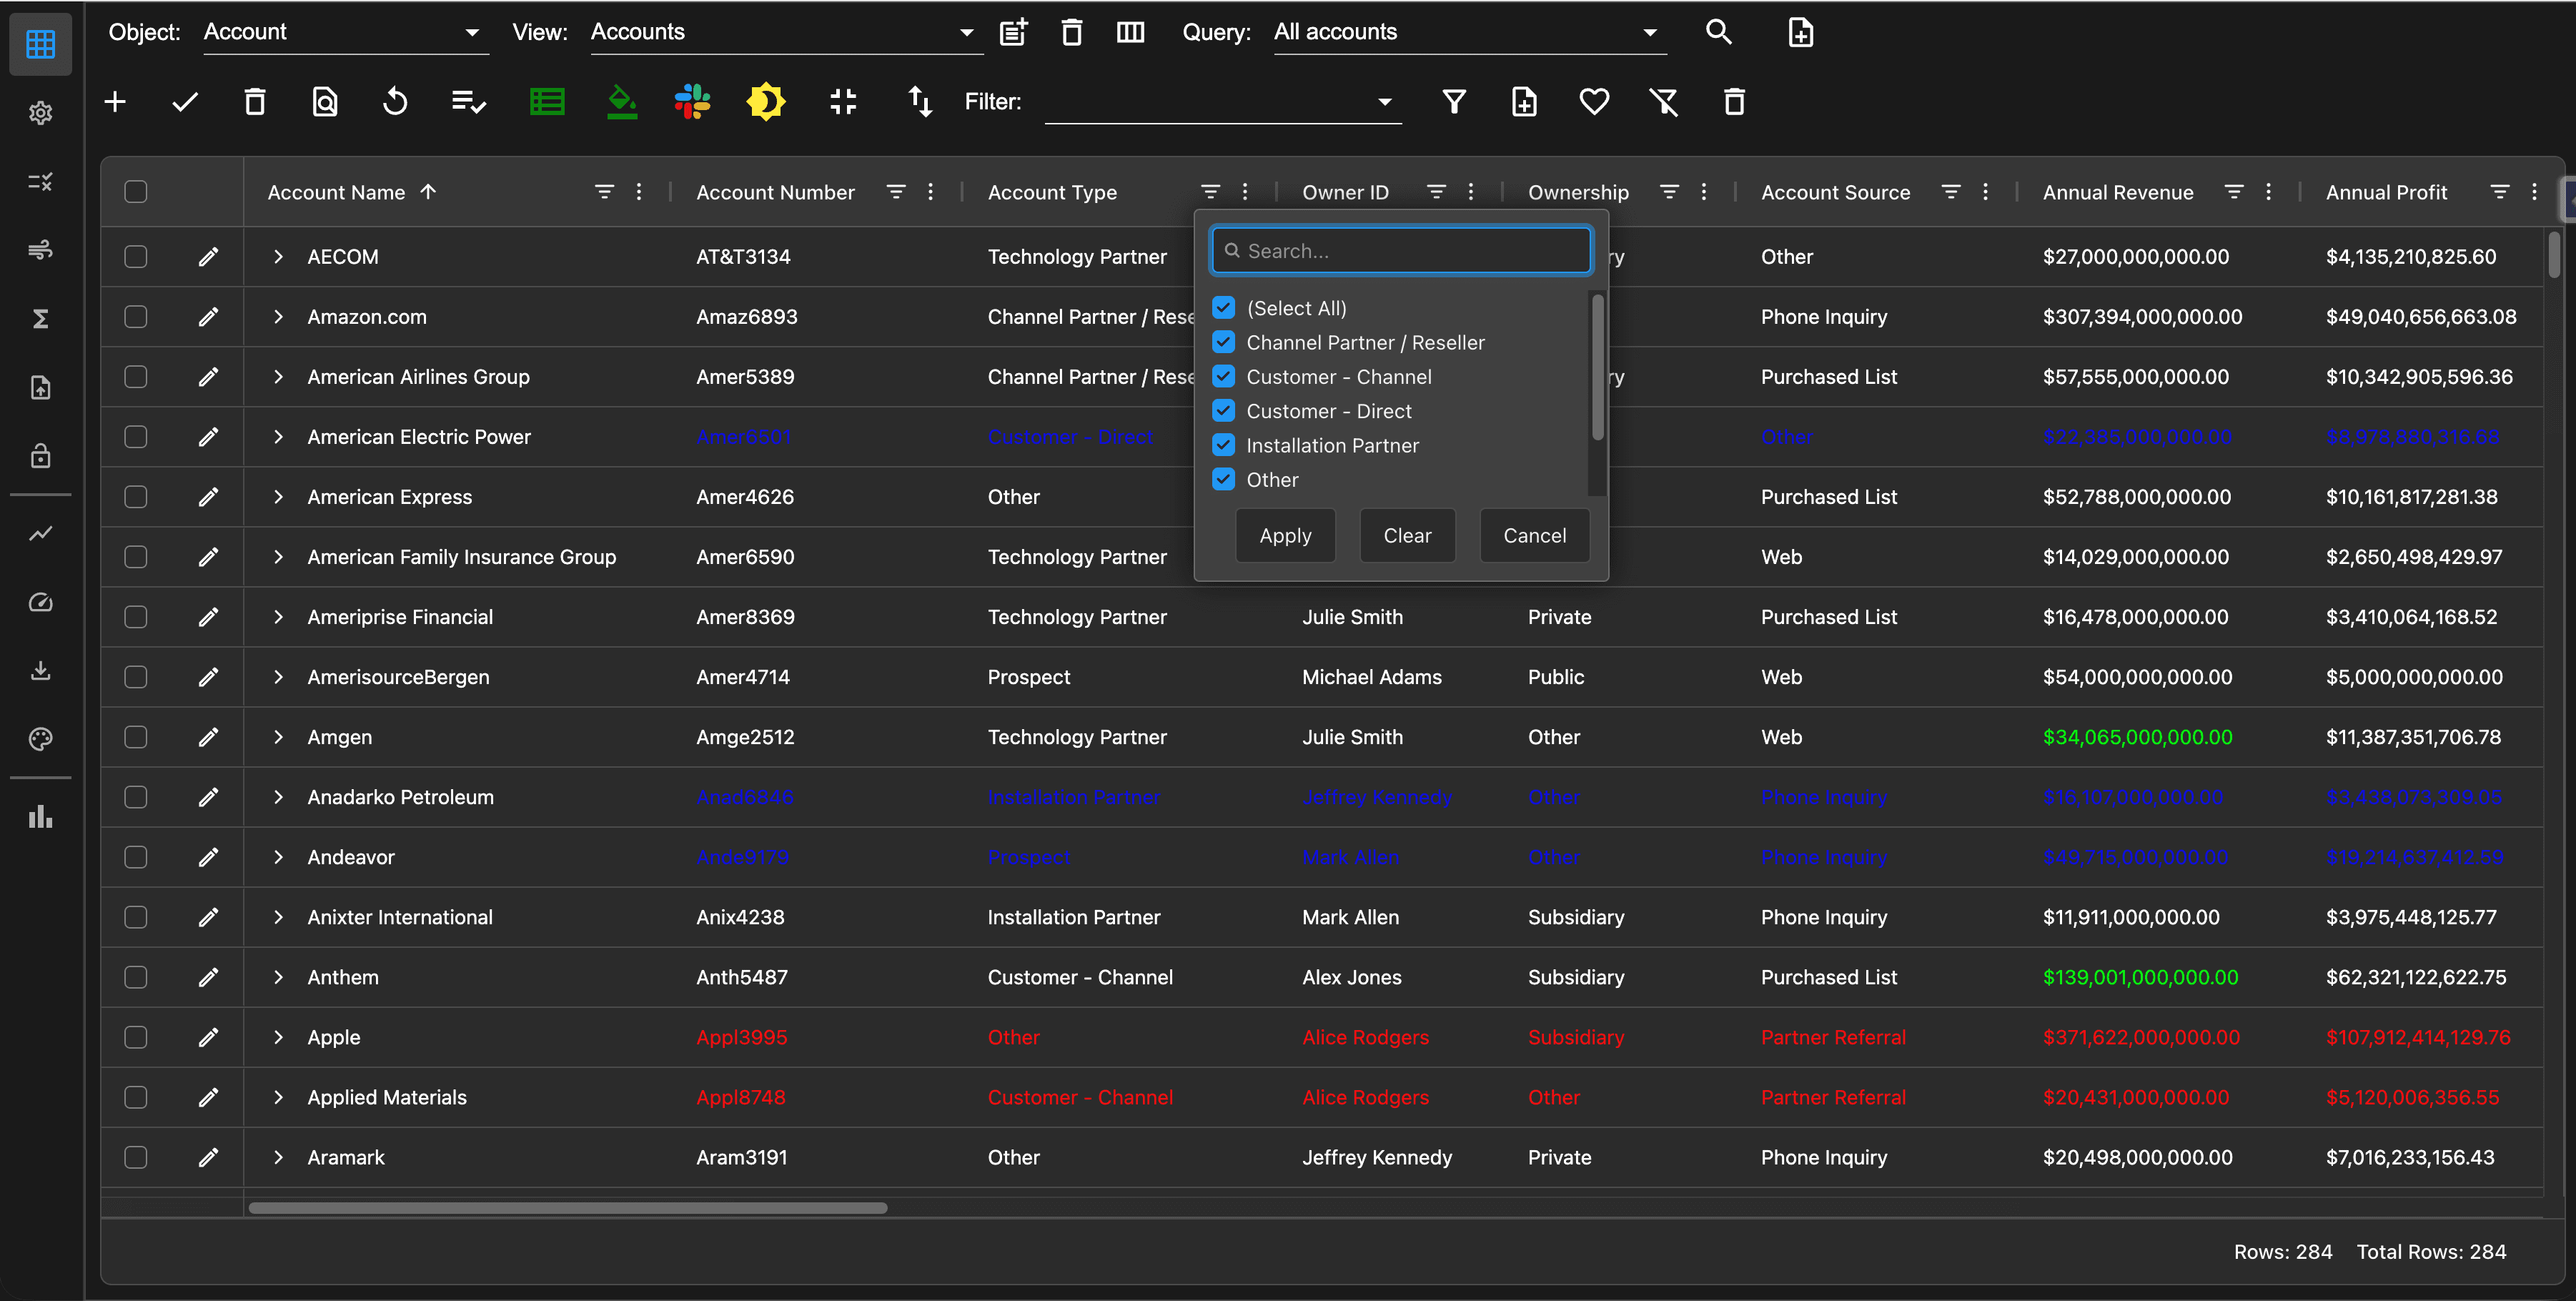
Beside each column, AppGrid displays a filter icon. Clicking the icon will open a filter dialog that allows you to create a filter expression that will filter the displayed data. If more than 1 column filter is created, AppGrid will apply all active filters. Click the Clear Filters button in the grid toolbar to clear all filters. When a filter is active, the Clear Filters button will be displayed in green to indicate that filters have been applied to the displayed data.
Using advanced multi-column filters
AppGrid provides the ability to create multi-column filter expressions that are more powerful than what can be achieved with regular column filters. Regular column filters are ANDed together when evaluated. Advanced column filters allow use of AND/OR and group logic when creating filter expressions. Note: filter expressions are created in relation to the selected view. In the image below, we have selected the Automotive accounts filter. The filter expression will be displayed above the grid in the filter expression box. You can directly edit the expression in the filter box, but it is easer to do it with graphical filter wizard.
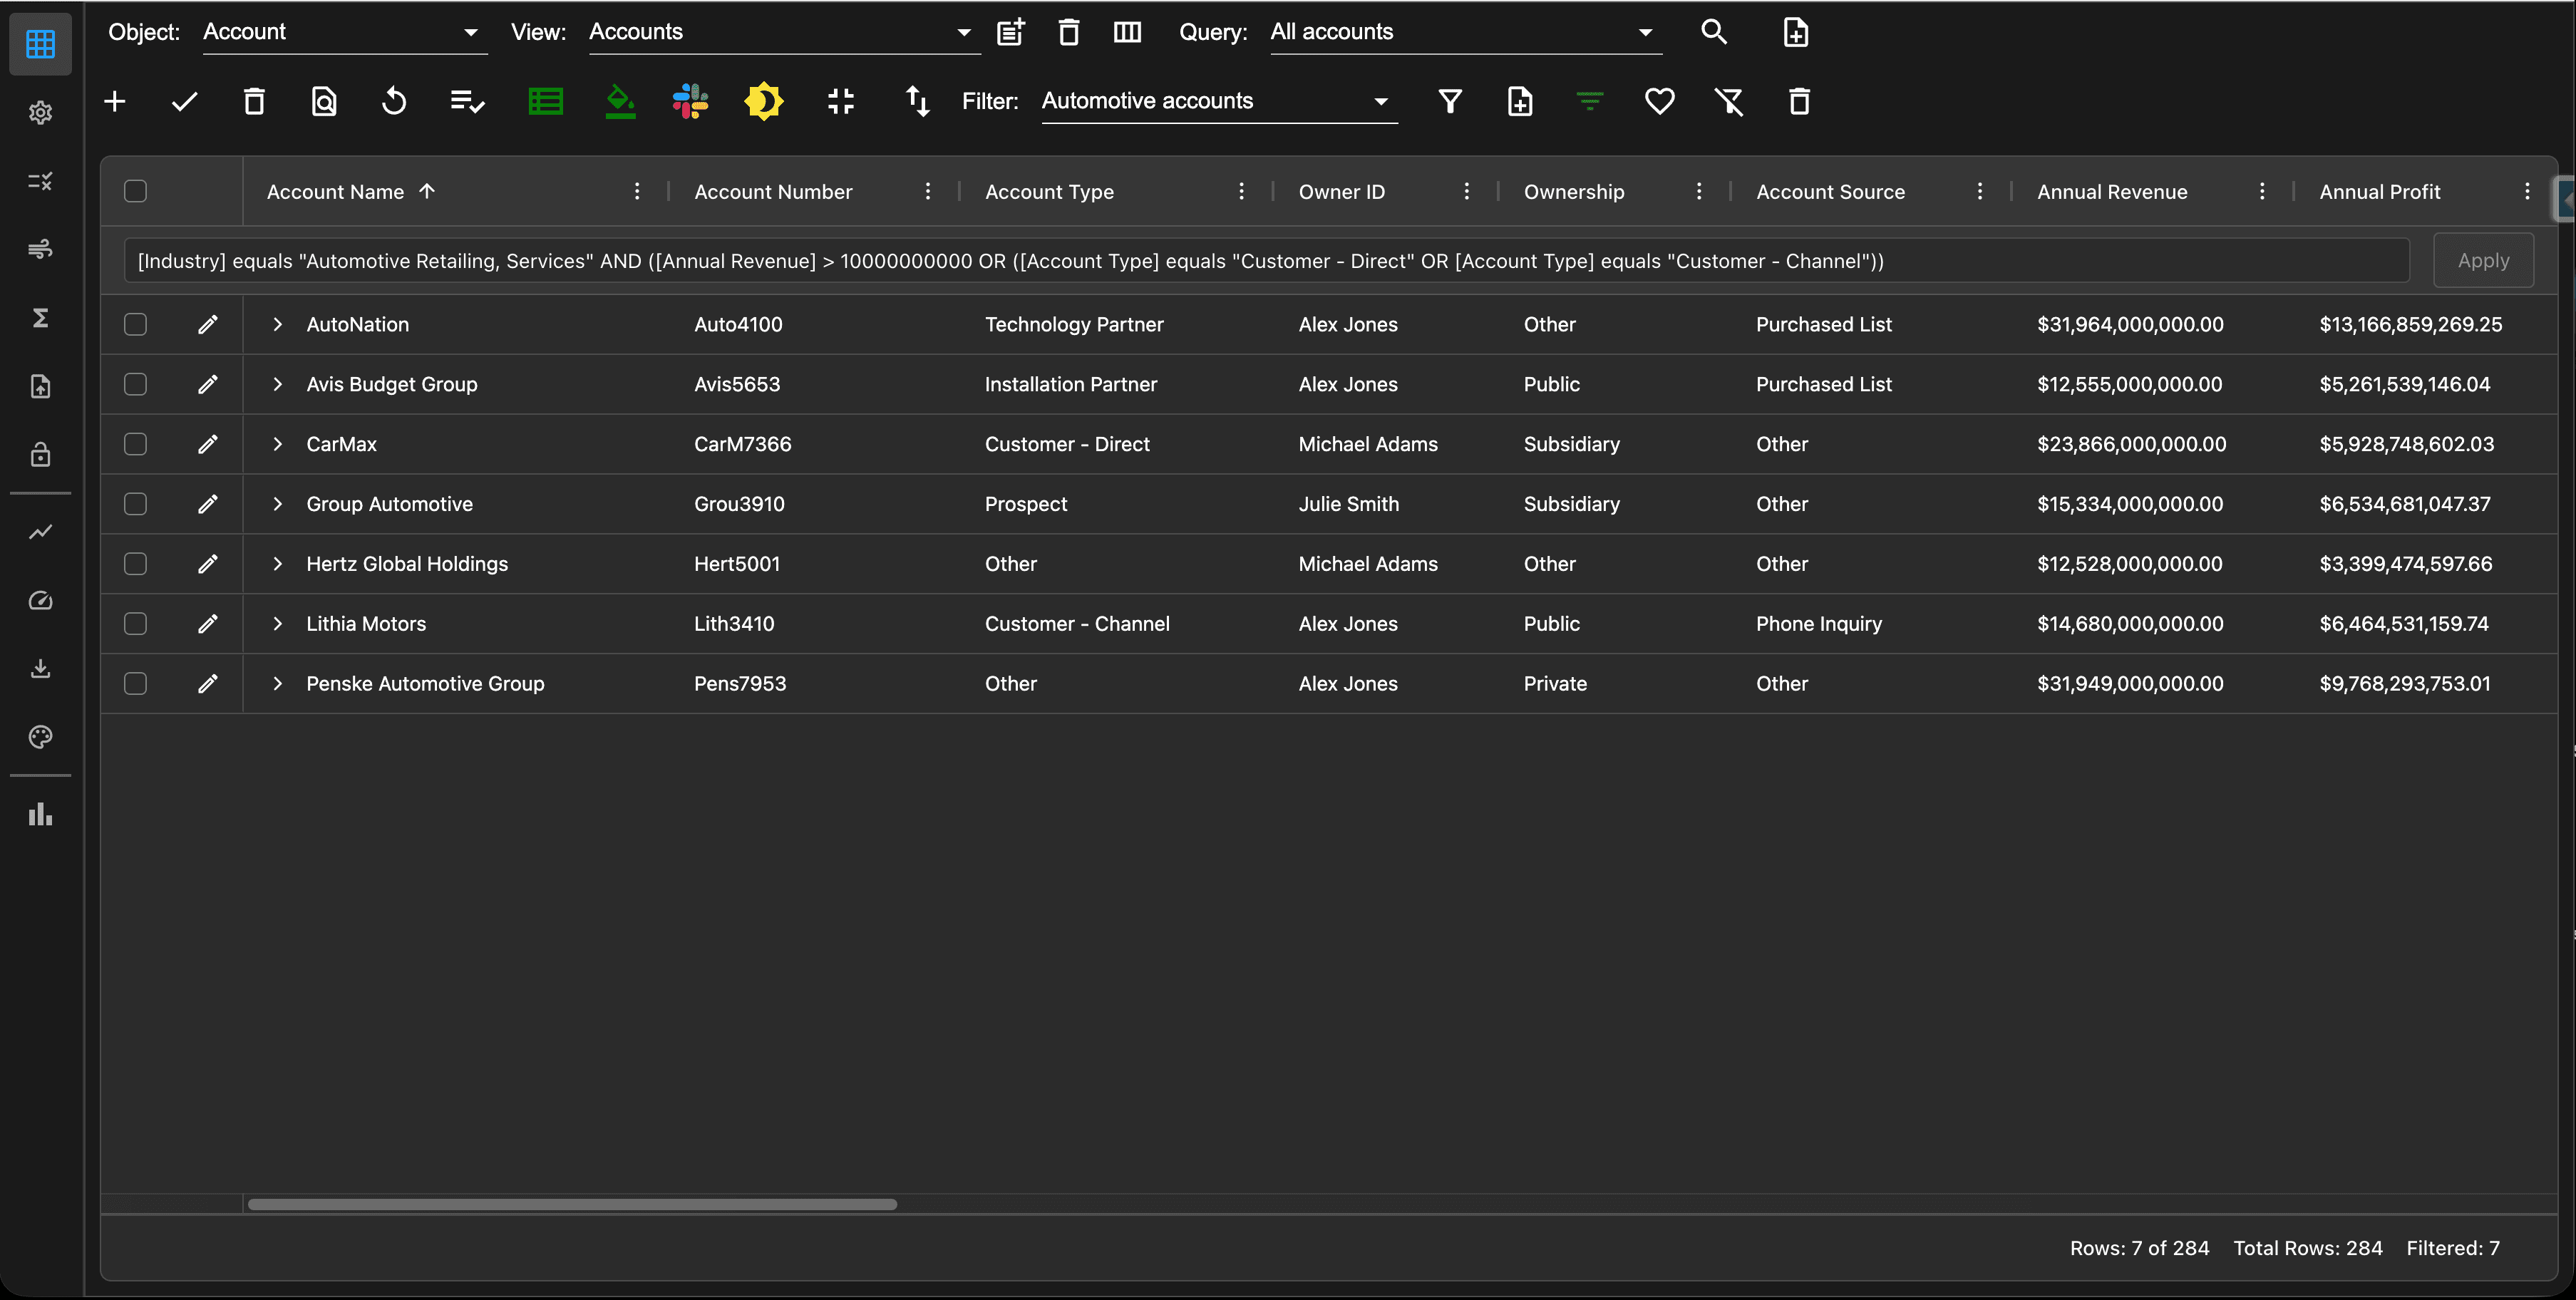
To open the advanced filter wizard, click the Enable Advanced Filter button in the grid toolbar.
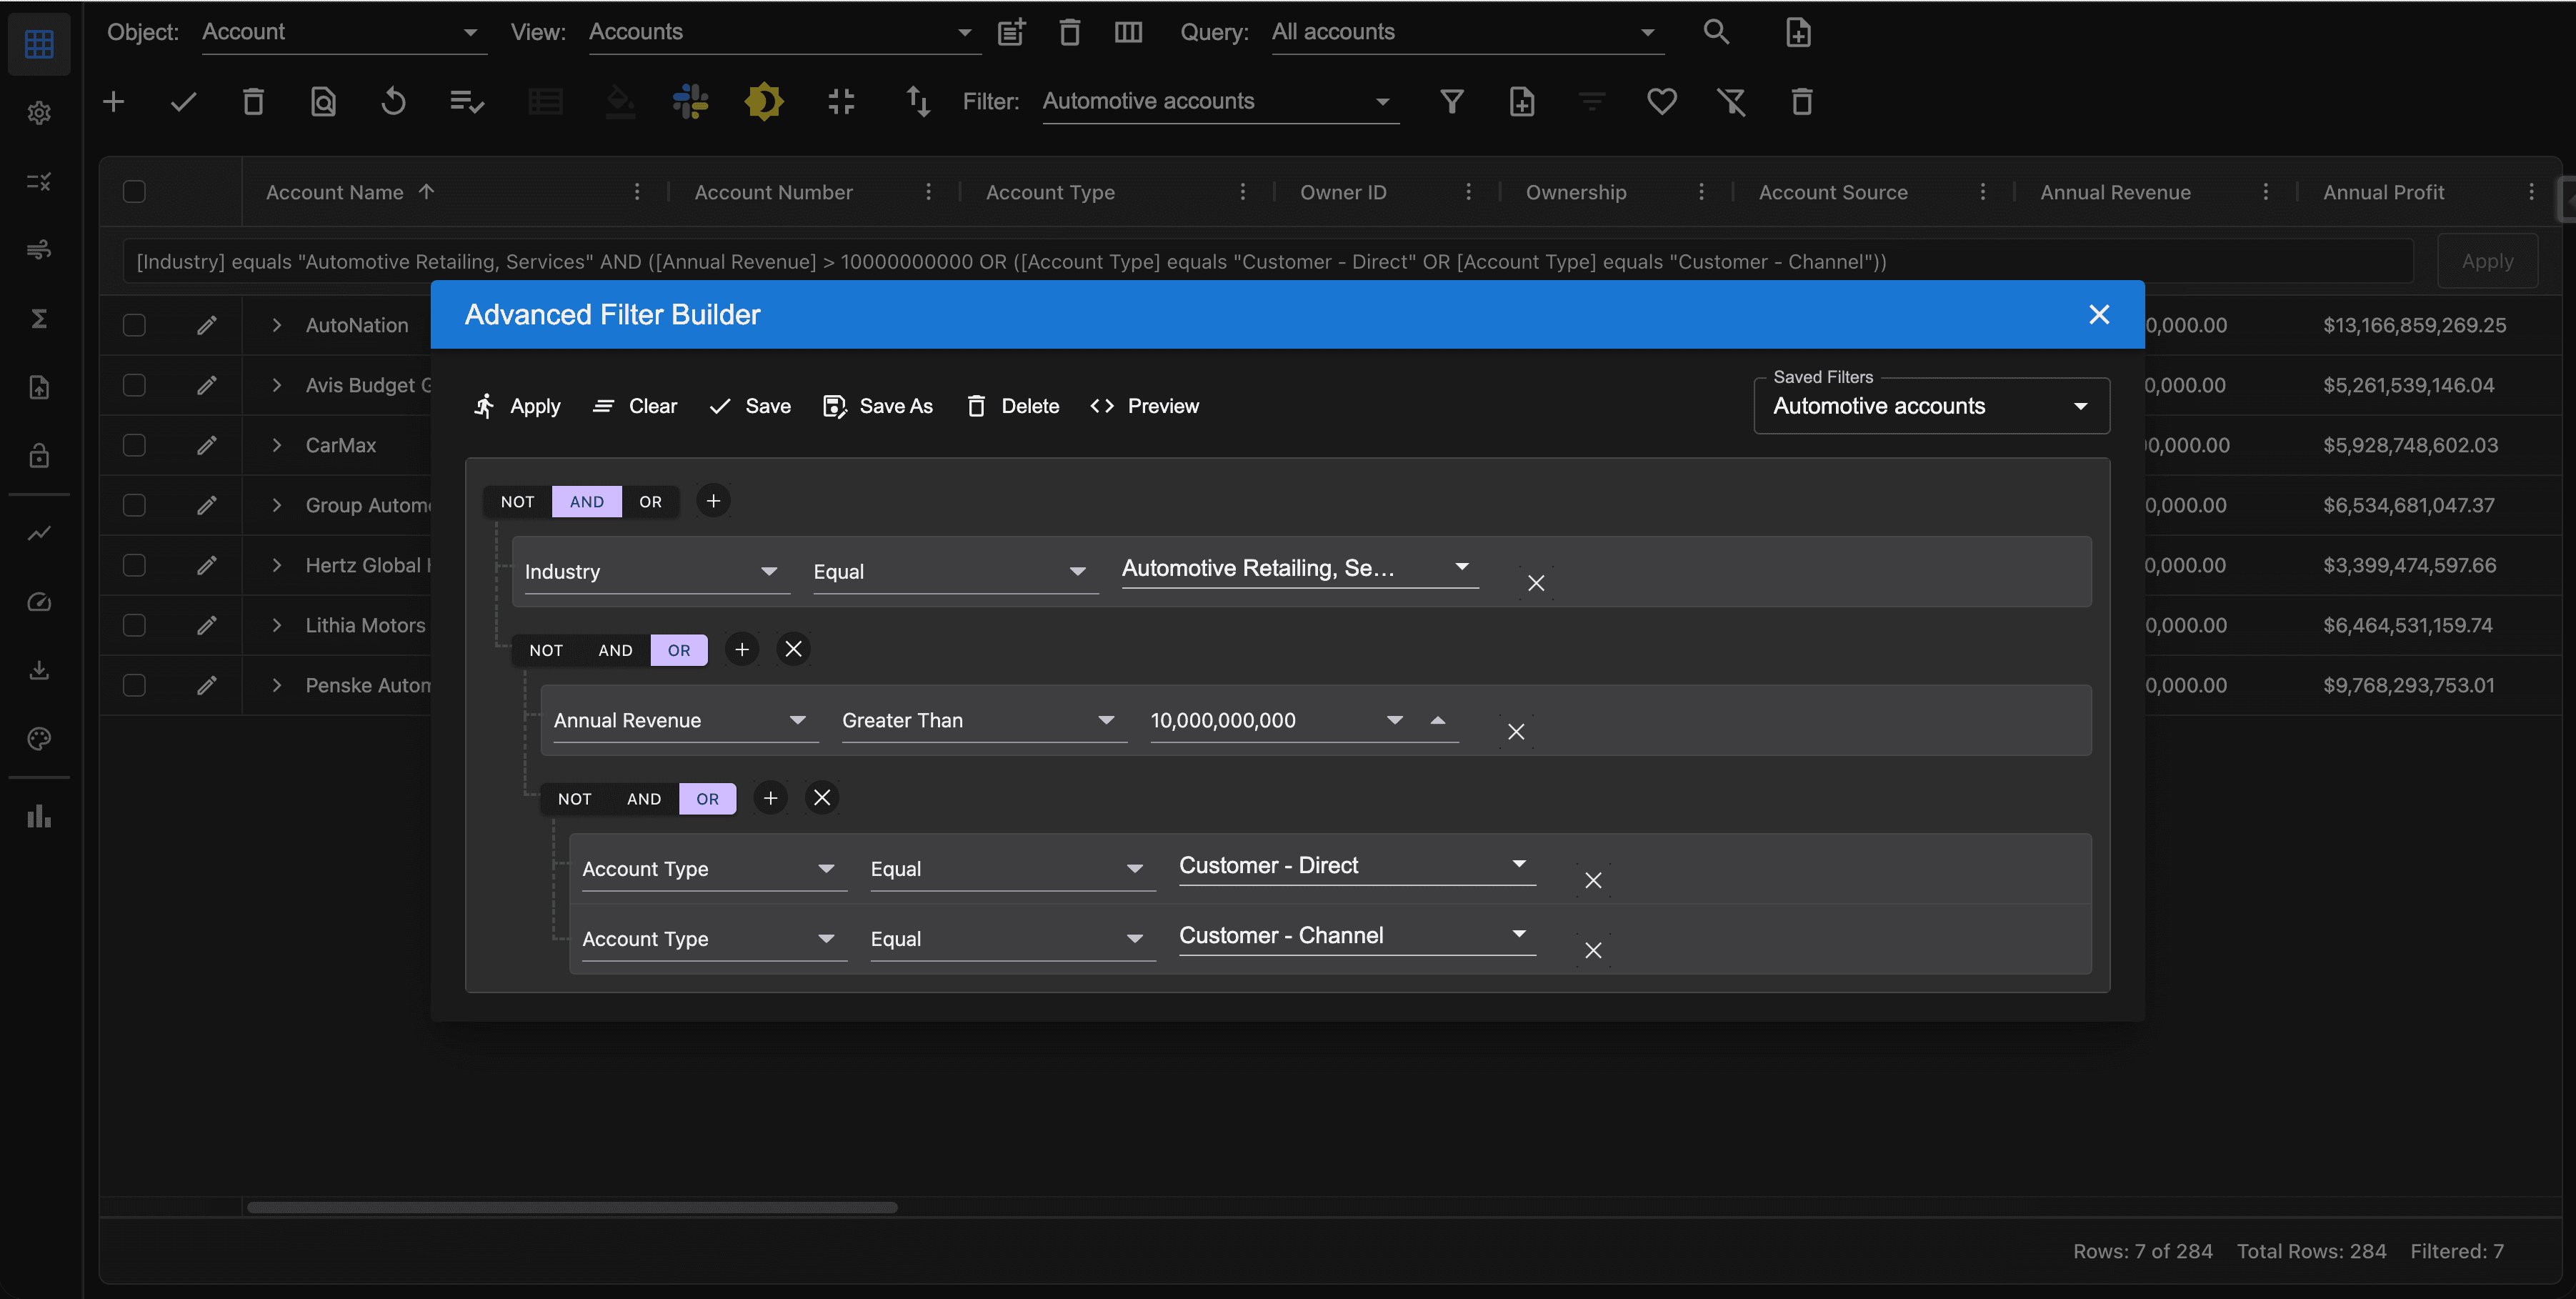
The advanced filter builder allows complex expressions to be created that use AND, OR and NOT operators and includes the ability to create group clauses, as shown in the image below. Adding group clauses create hierarchical filter expressions. There is no limit to the depth of the expressions that can be created.
You can click the Preview button to see the filter expressed in either JSON or SOQL. The preview panel helps users to understand the expression logic.
Click Apply to immediately load the filter expression in the grid. Click Clear to remove the current expression from the filter builder. The Save button will be shown if editing an existing filter. Clicking Save will update the existing filter with the new expression. The SaveAs button will create a new filter. Clicking Delete will delete the expression.
You can also load an existing filter by selecting it from the filter dropdown. After saving the filter, the grid will apply the new filter. When a filter is active, the filter icon and the clear filter icon will turn green.
Creating views
AppGrid provides the ability to create multiple views for a given object. If we are viewing Account records, we may want to configure a list view, a grouped view and/or a pivot view. Depending on our workflow, this allows us to present information in the most optimal way to accomplish our task.
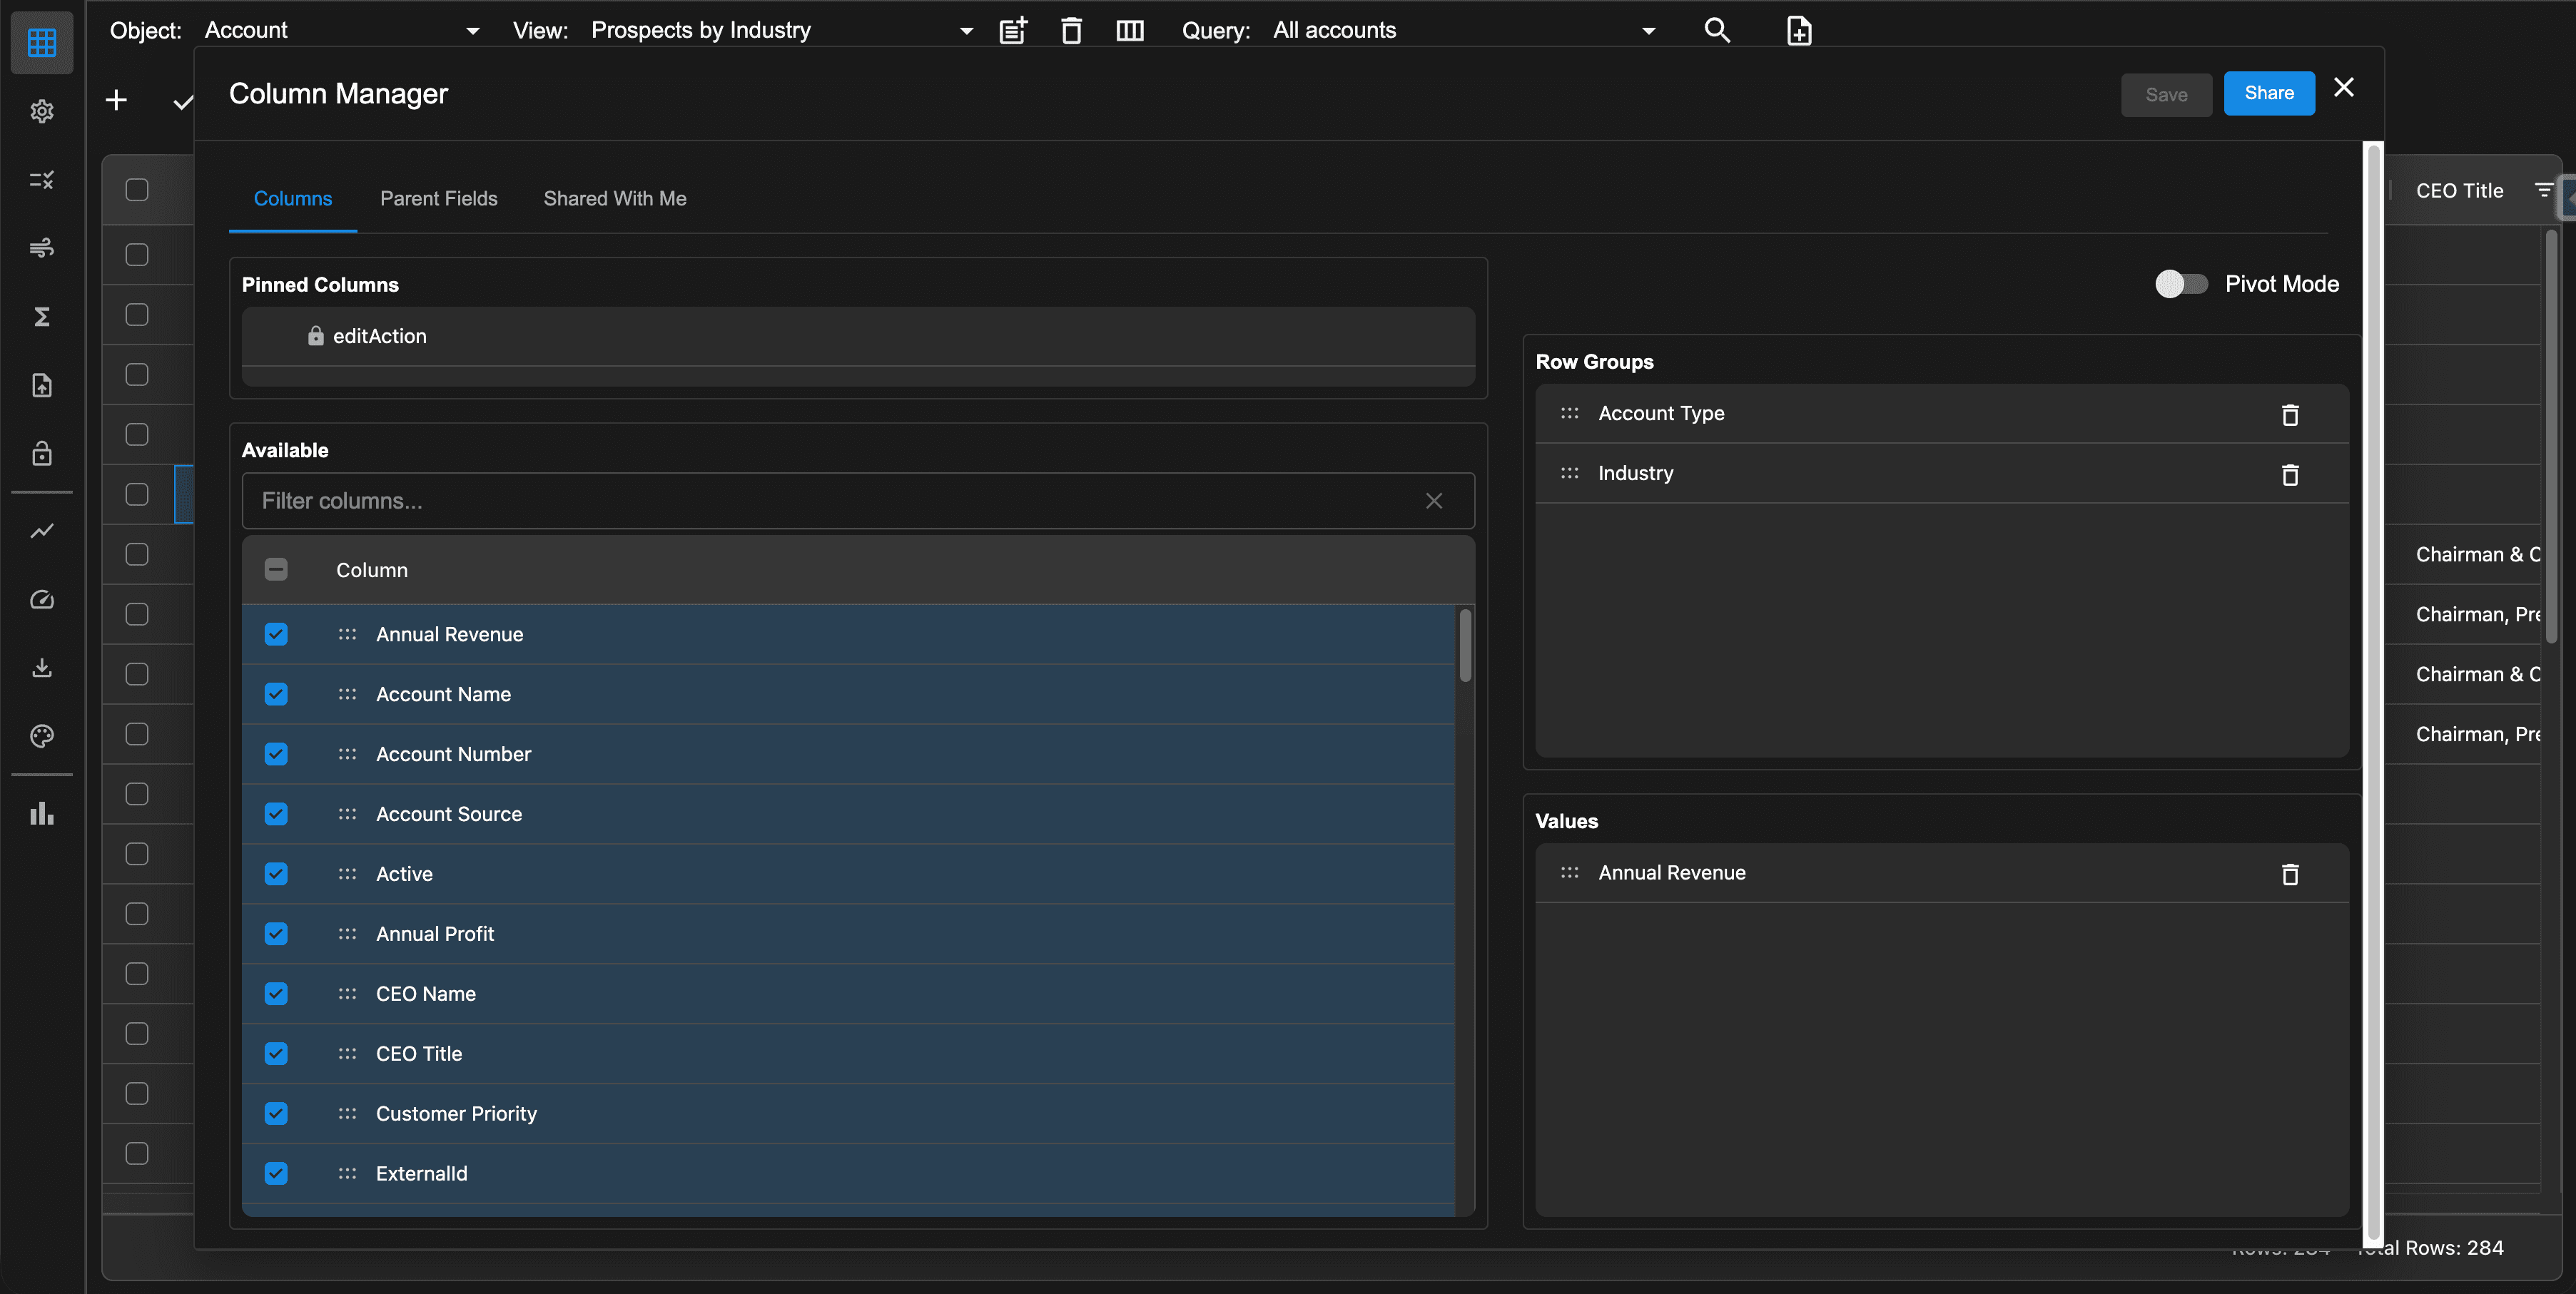
To create a view, click on the Create Template toolbar button and enter the name for the new view. Then click the Columns Wizard toolbar button to define the view peferences. Drag one or more columns into the Row Groups section to create a grouped view. Add one or more numberical columns into the value section. Beside each group will be an aggregation of the grouped values. Click on the Parent Fileds tab to add fields from a direct parent relation. Drag any column in the Available fields section to reorder the columns displayed in the view. To create a pivot view, click the Pivot Mode radio button, and then add your desired pivot column(s).
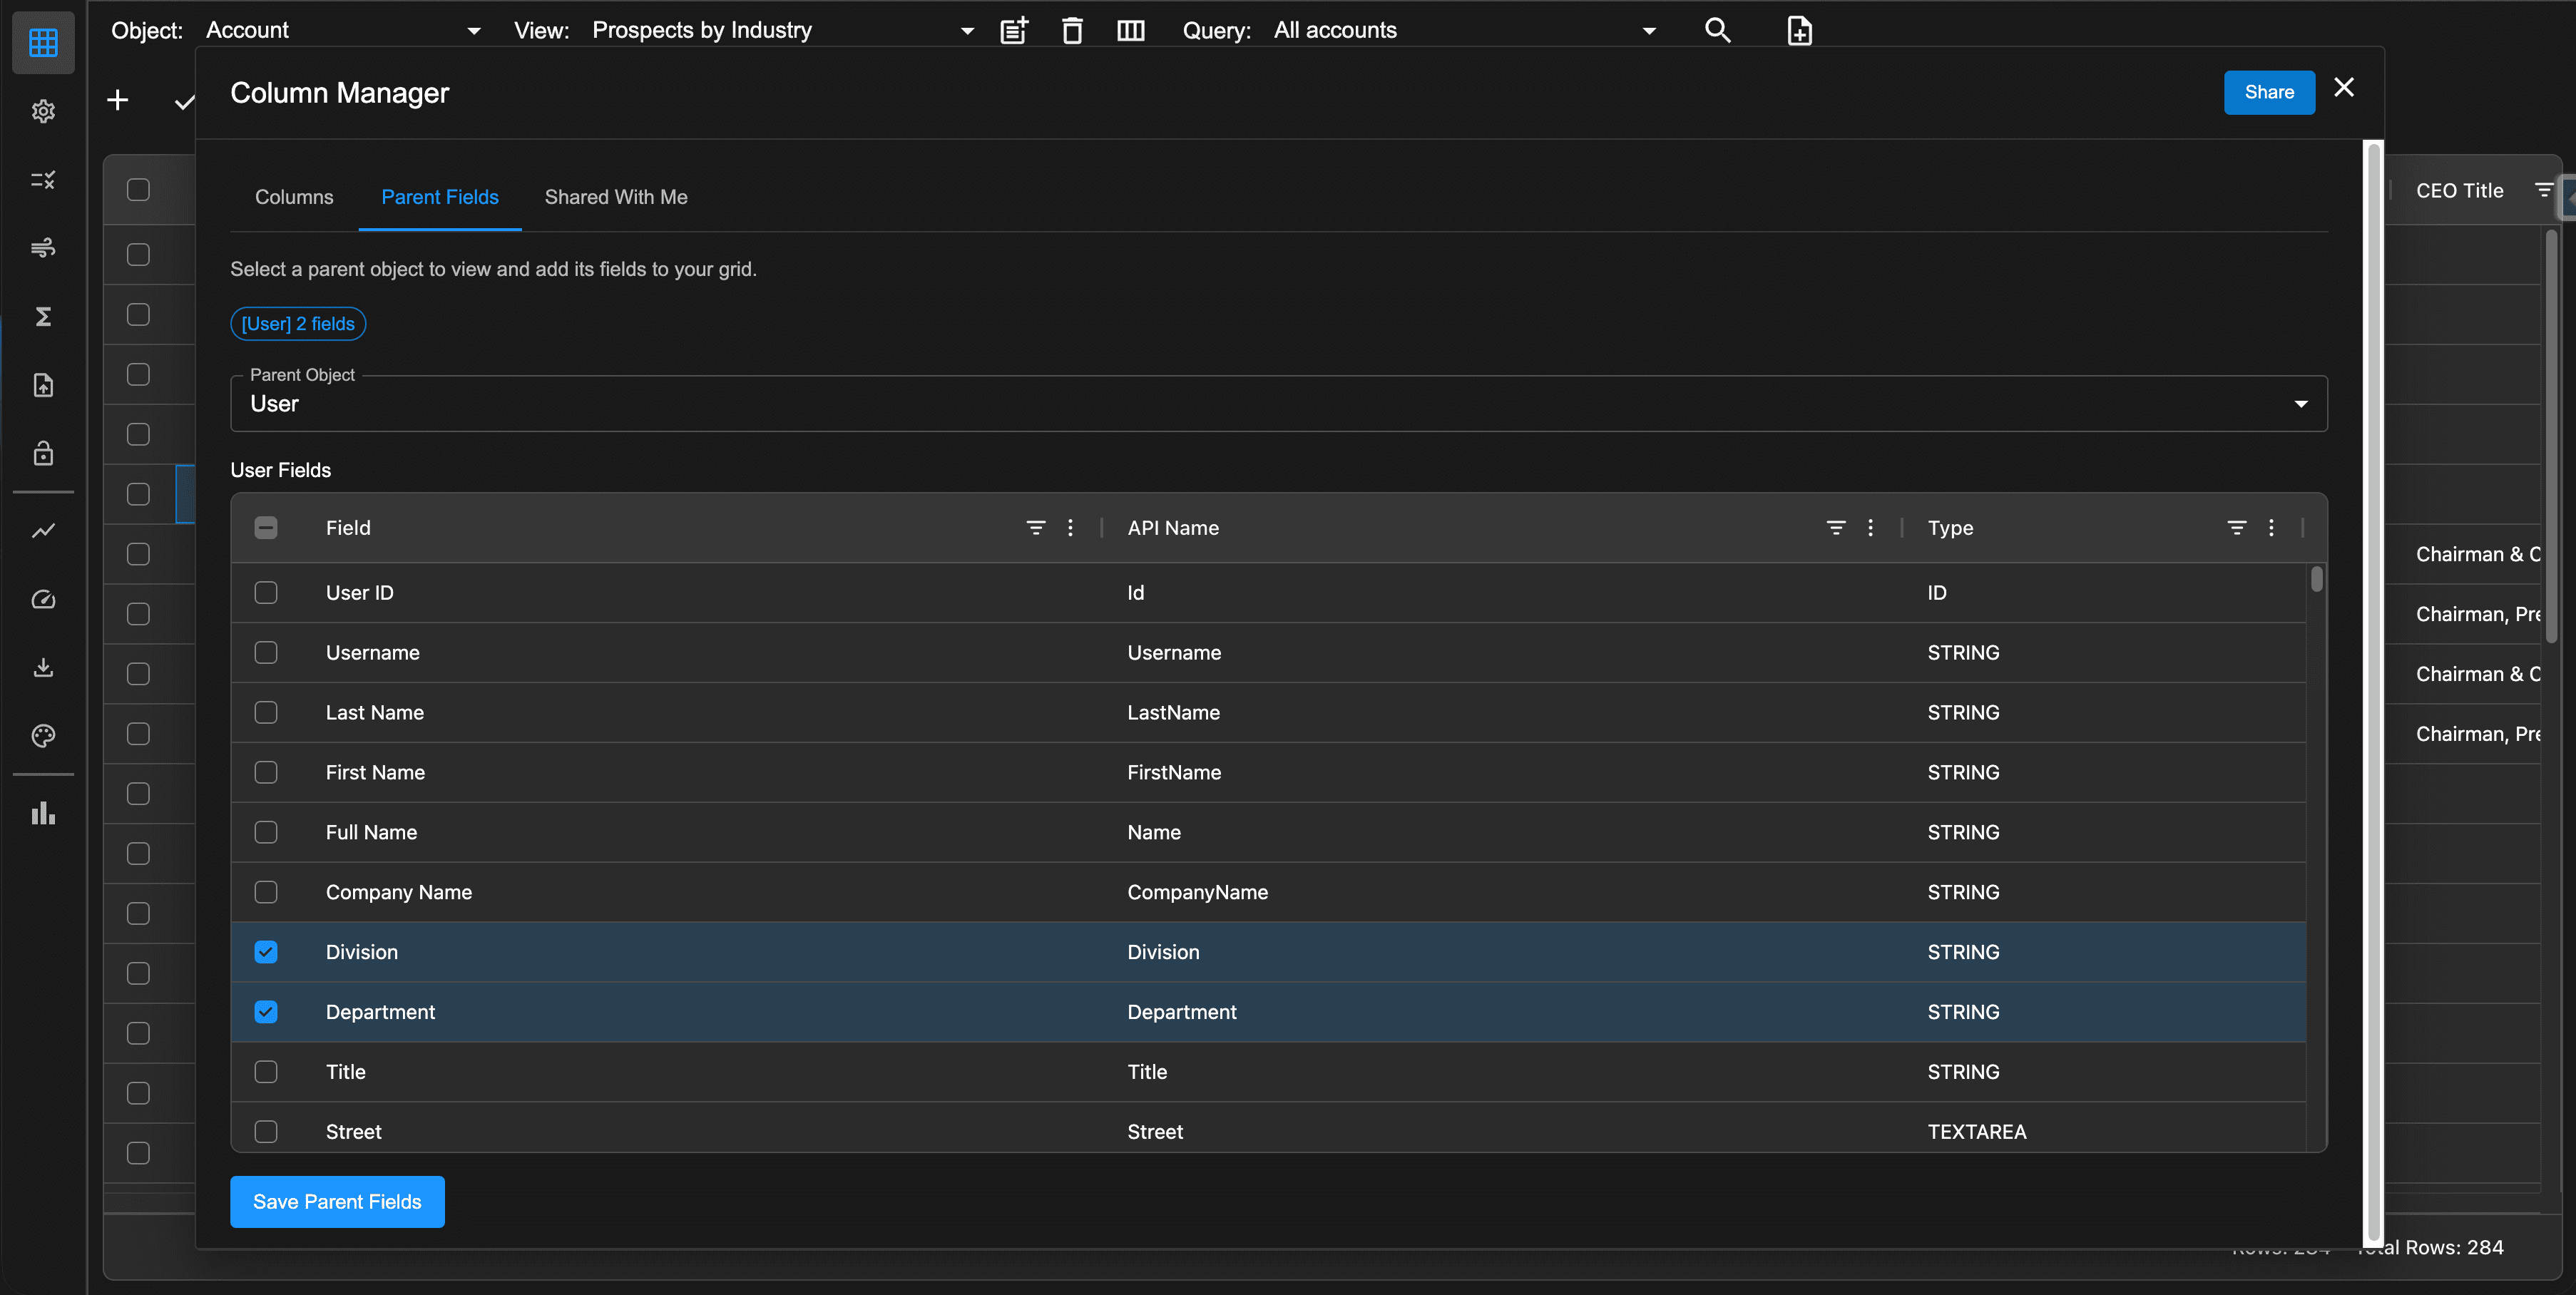
When defining a view, we can optionally add fields from a direct parent relation. In the image below, we have selected the User object. We added the Division and Department fields. This will be a read-only column.
Be sure to click the Save button to persist your parent relation fields.
These 2 fields will be added to the view and displayed like this: [User] Division and [User] Department
It is quite common for an object (ex: Contacts) to appear in the main grid and also as a subgrid. It does take some effort to create a view and AppGrid provides a way to reuse a parent grid view when creating a subgrid view.
When a user opens a subgrid for a given object, AppGrid will check if a view has been defined for the subgrid. If not, it will check if a view exists for the main grid for that object. If it finds a single list view for the parent, it will clone it automatically. If it finds multiple list views for the parent, AppGrid will display a dialog allowing the user to pick which view to clone. If no parent views are found, it will create a default view automatically based on that objects metadata.
Creating queries
AppGrid provides the ability to create multiple queries for a given object. To open the query wizard, click the search button in the grid toolbar. The query wizard will open in a dialog.
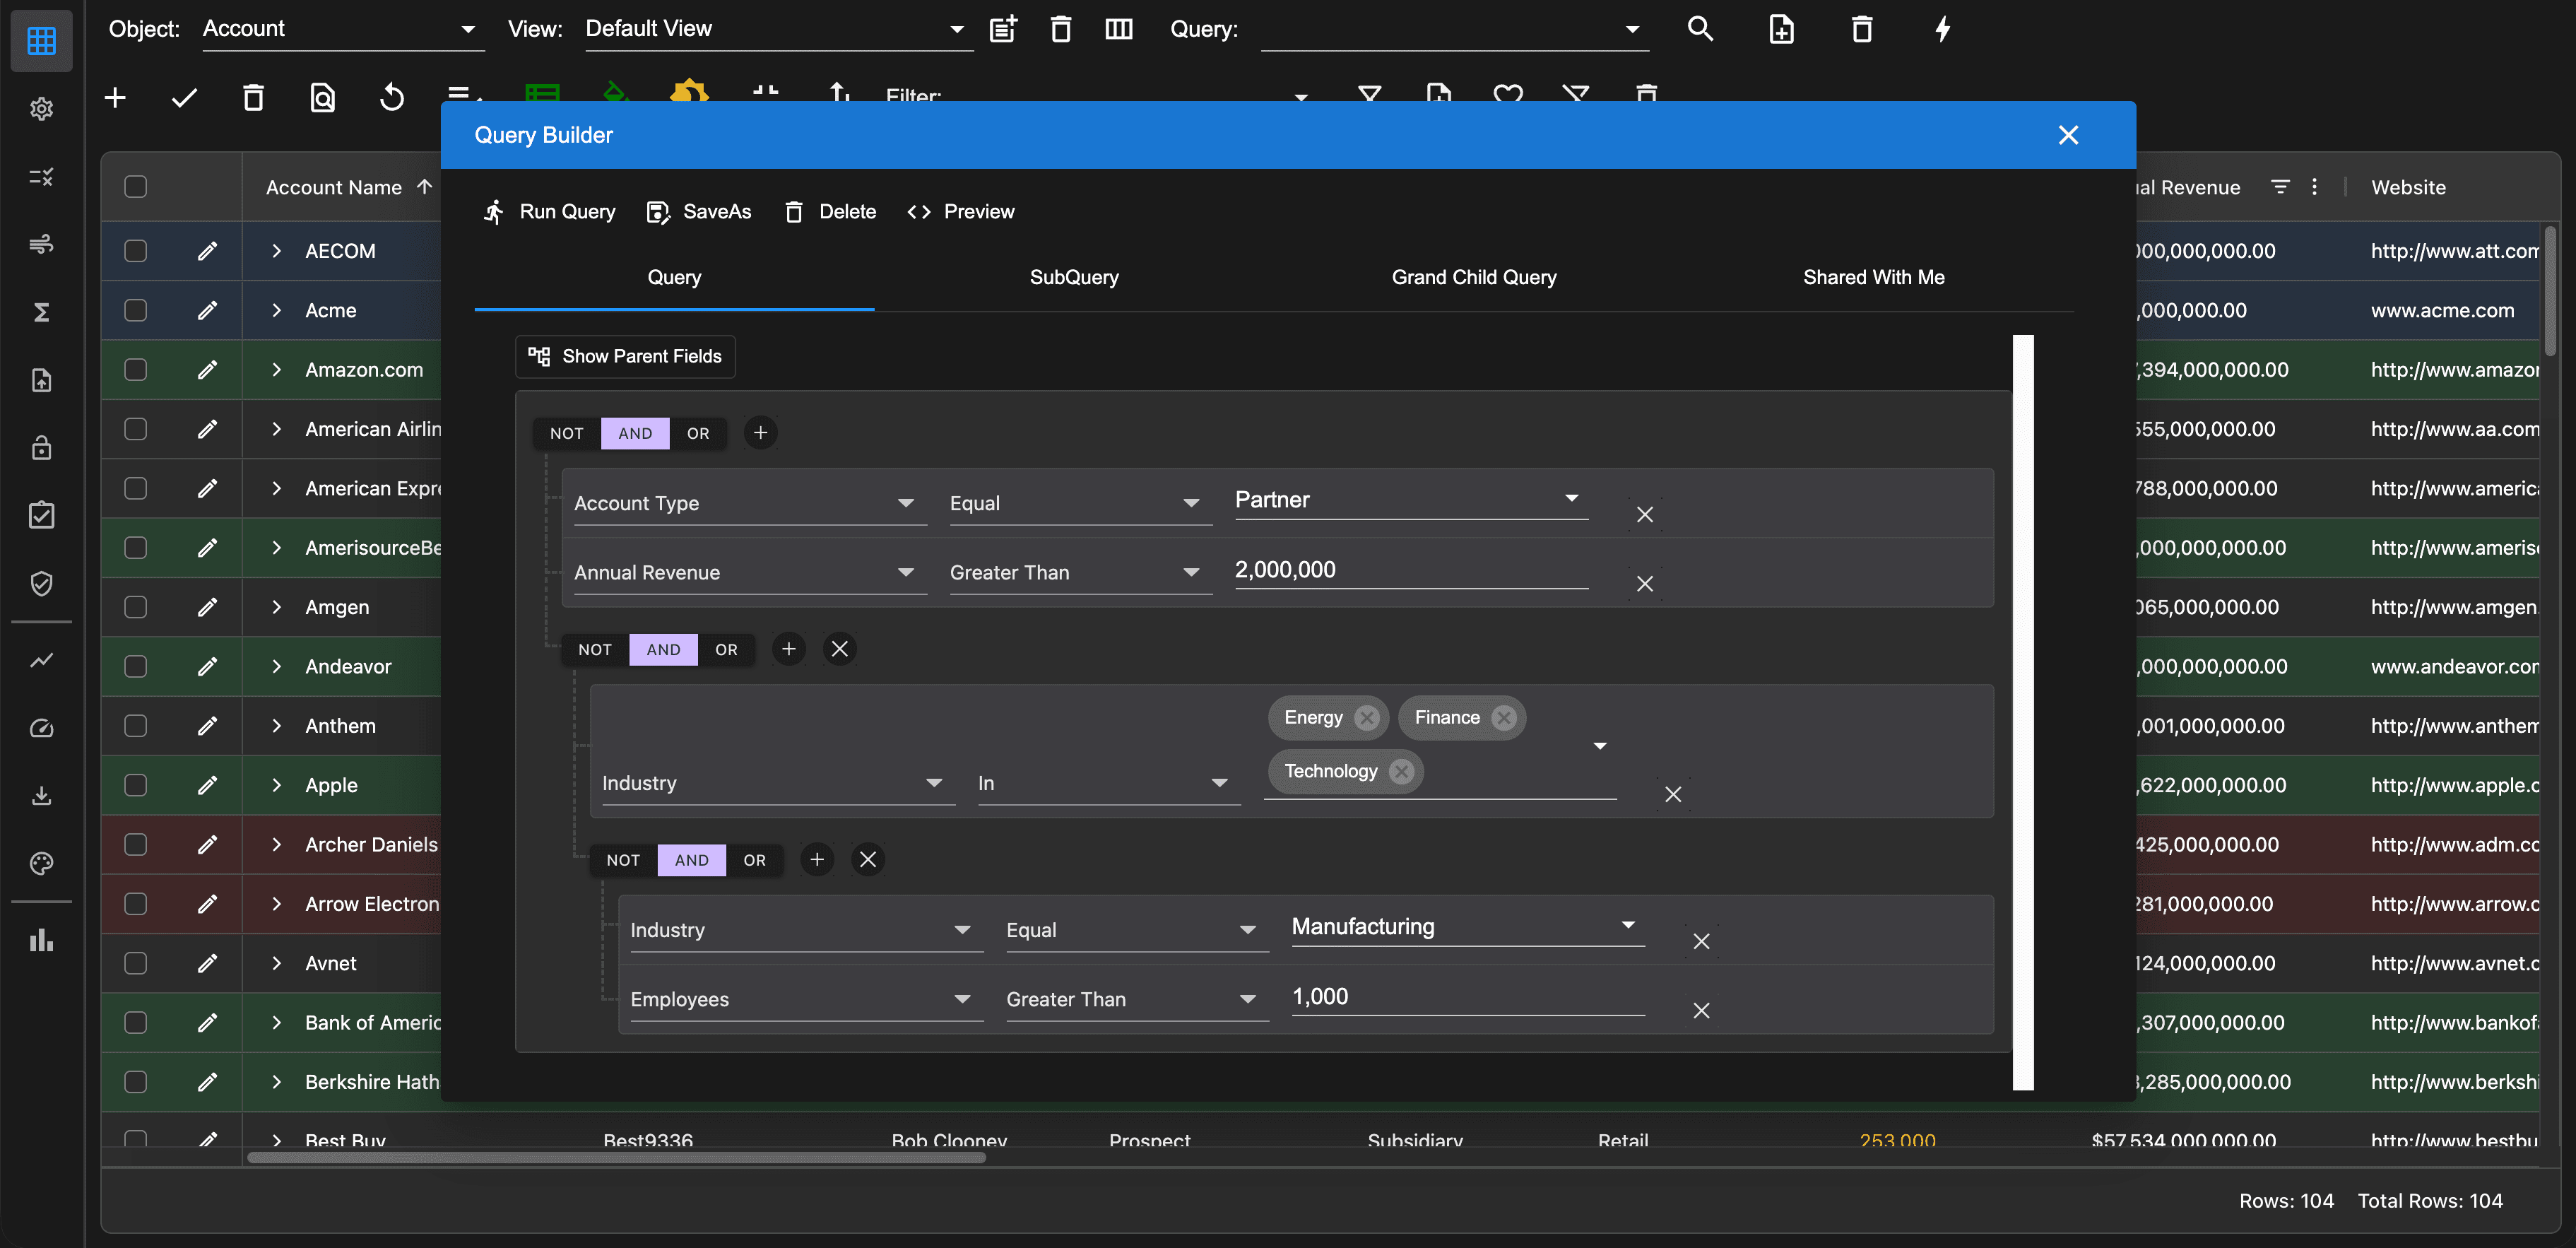
The query wizard provides the ability to create a query for the selected object. Using the graphical query builder, it makes it really easy for business users to create complex queries that return the exact set of records needed for a given workflow, eliminating the burden of scrolling thru records not of interest.
This also accelerates business operations that involve multiple records because users can use our Flow integration to process records in mass.
It enables creation of hierarchical queries by adding group clauses. We can create a query clause that includes a parent relation field. See our blog post 'Including parent fields in queries' for more details.
It also supports the ability to create a subquery. This is a really powerful feature that adds a great deal of intelligence to our searches. We can add a subquery on any direct child relationship of the selected object. If a subquery is defined, the effect is to add additional filtering logic to the query. For example, we may wish to query Accounts that have an Activity of a certain type.
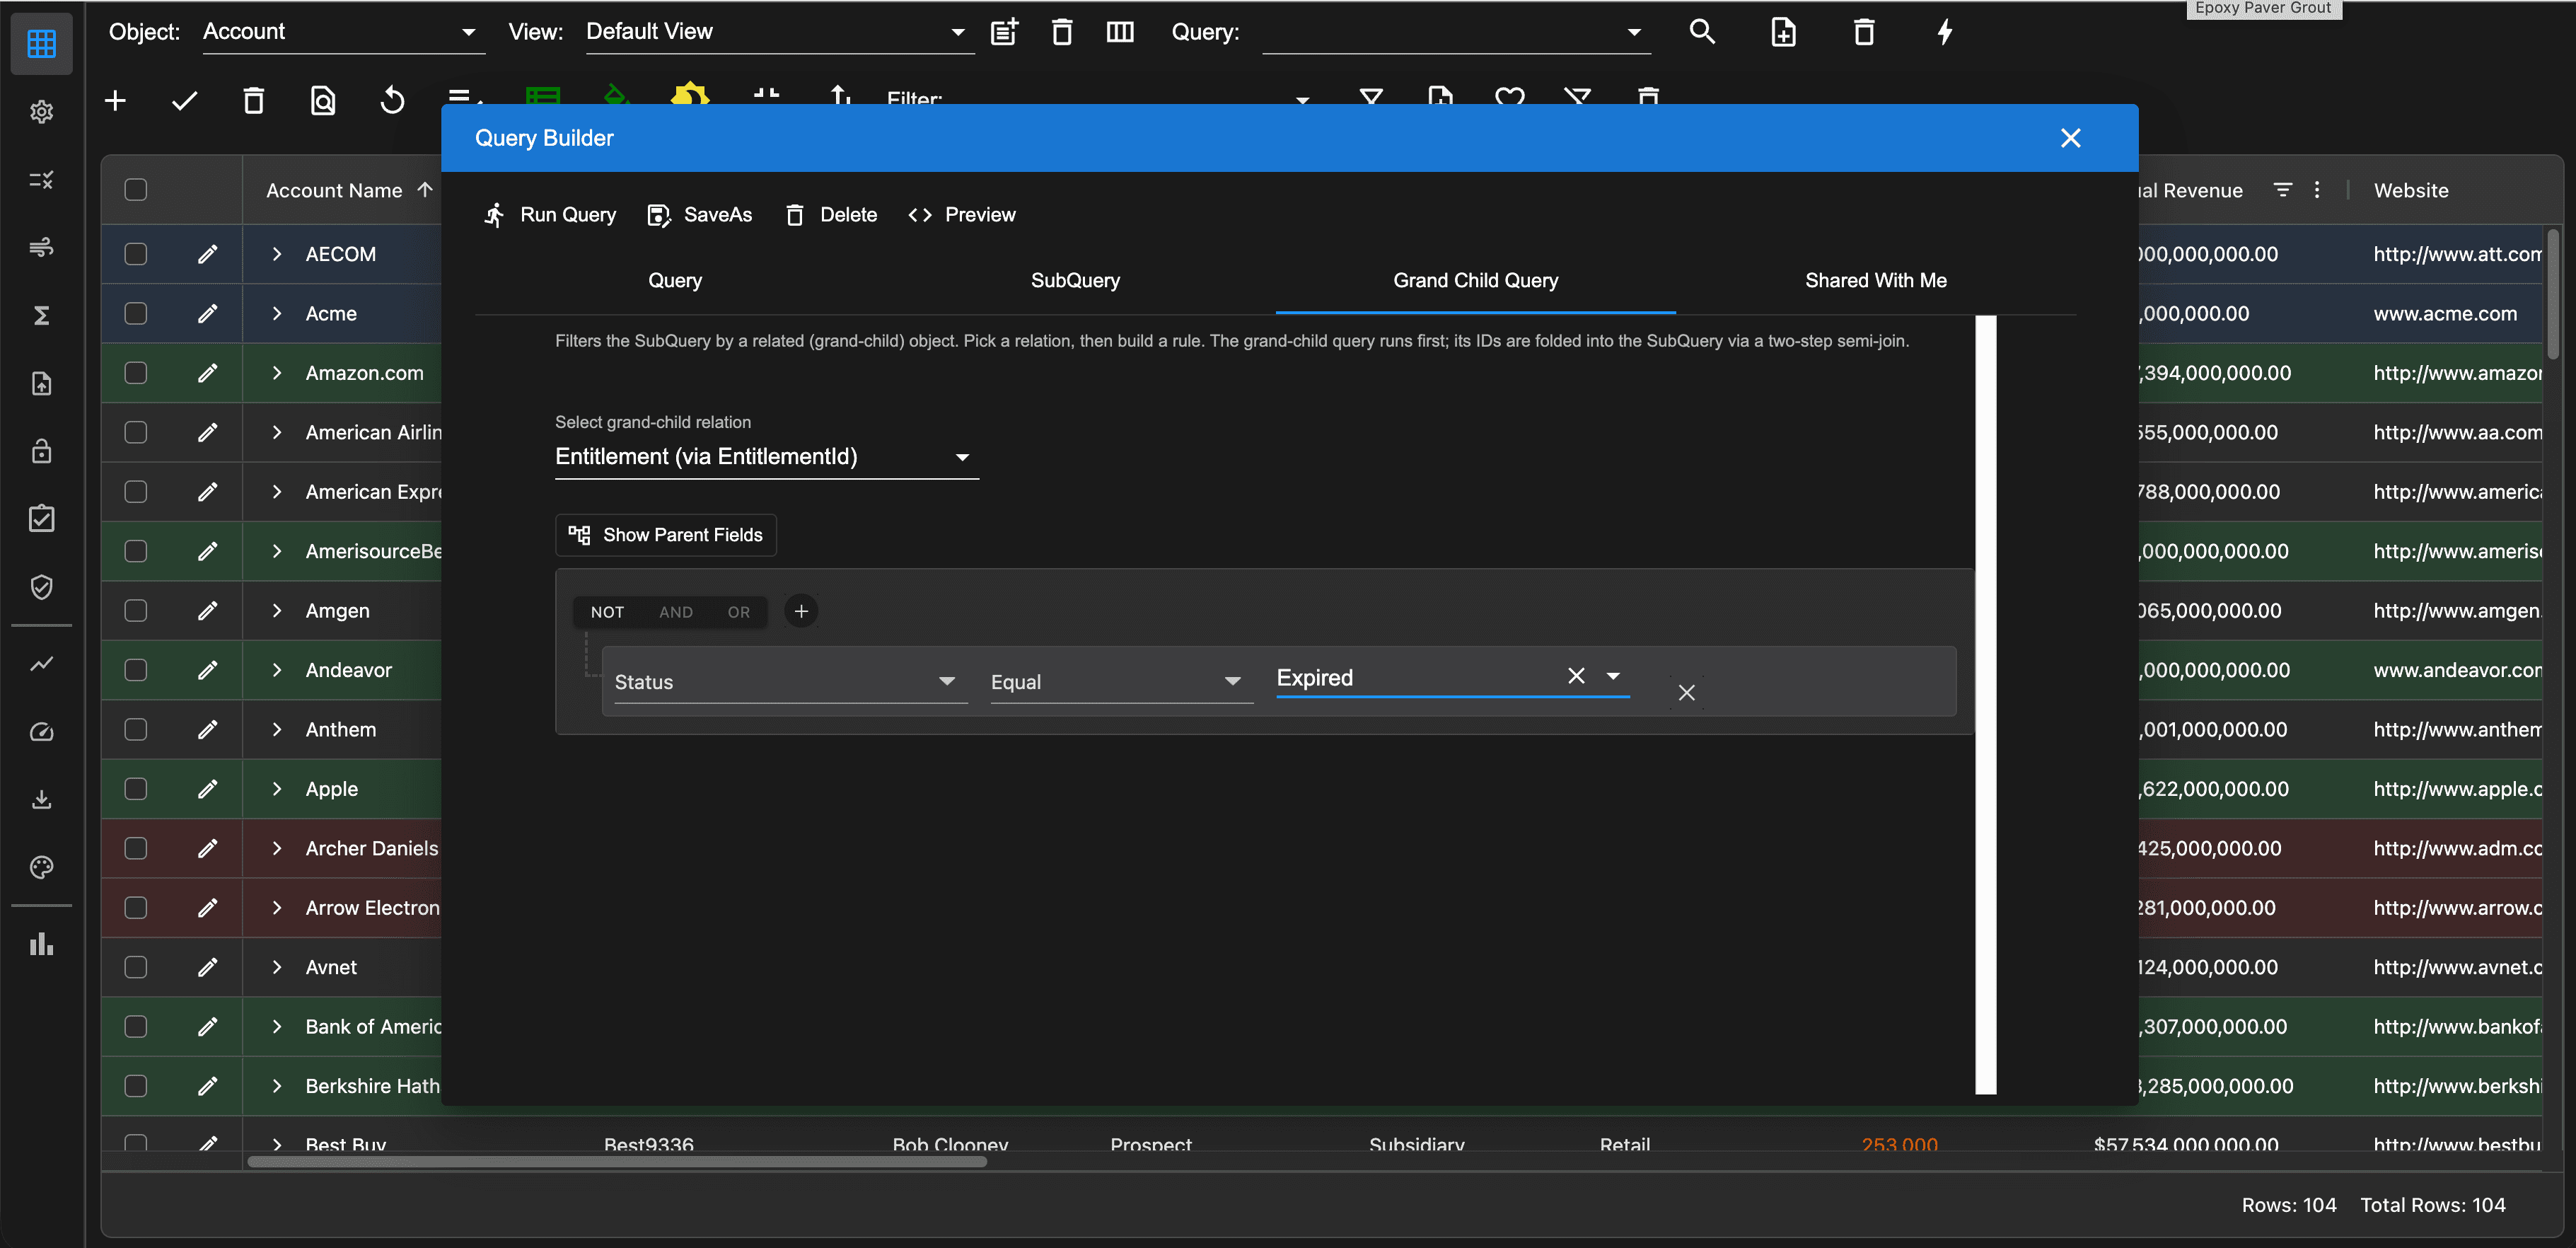
We also support the ability to create a grandchild query. If defined, the result is a 3 level hierarchical query.
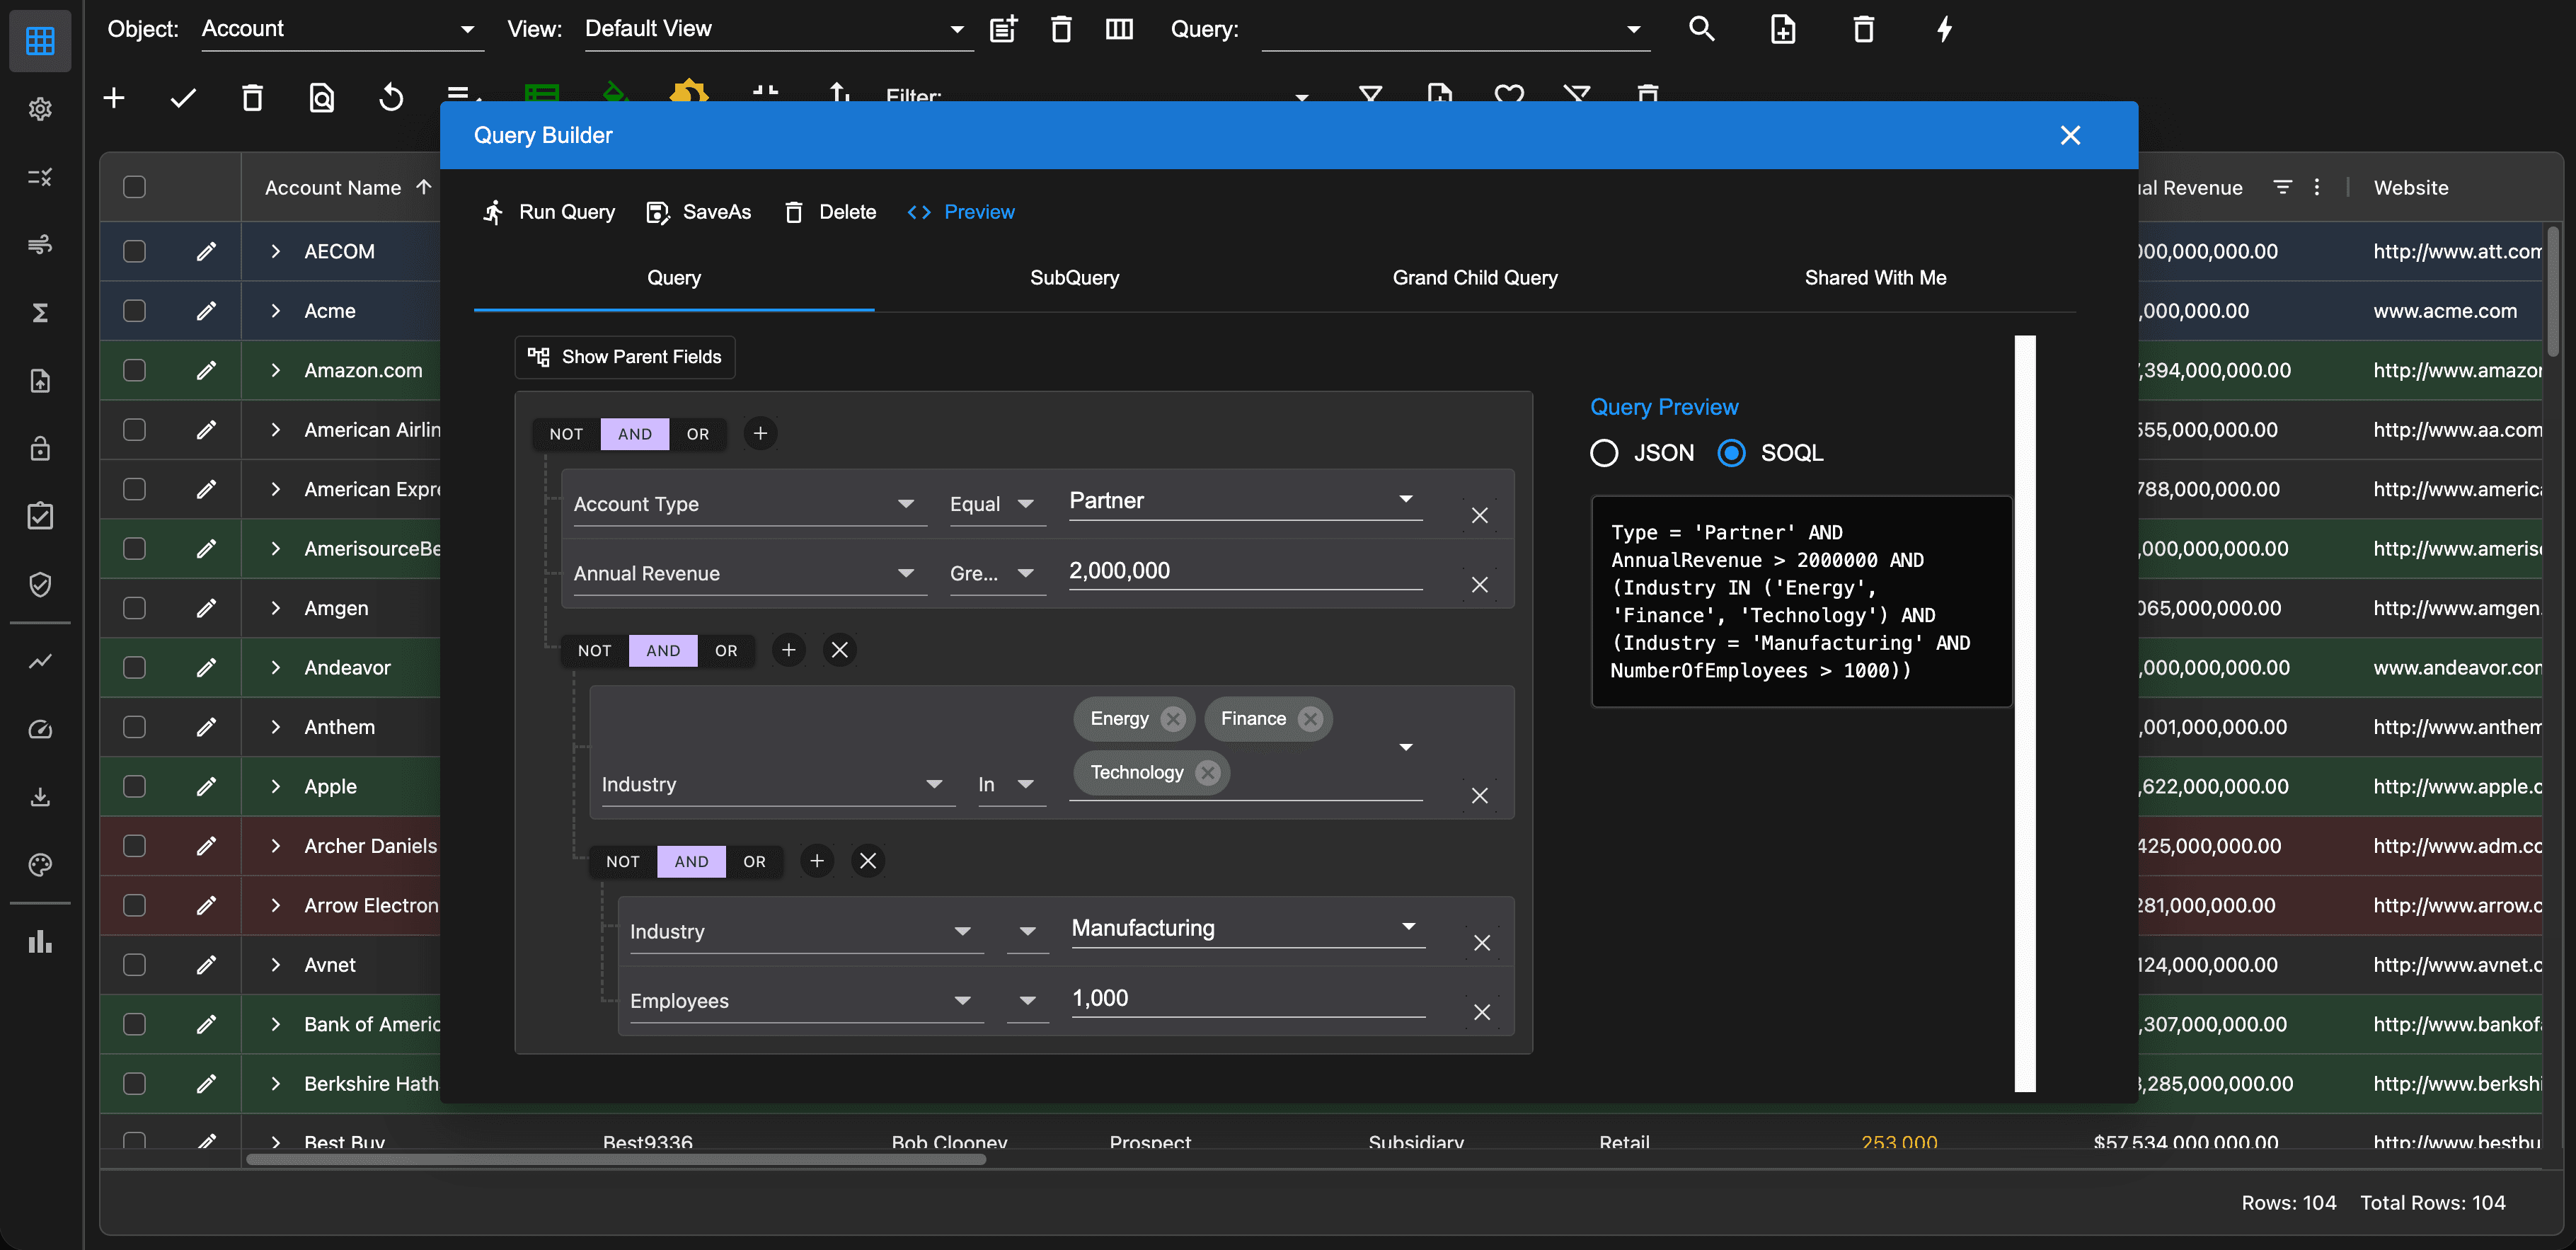
In the image above, we created a complex 4 level hierarchical query to demonstrate the ability of the AppGrid query functionality. This query finds accounts where all of the following are true:
Account Type is either "Customer - Direct" or "Customer - Channel"
Annual Revenue is greater than $2,000,000
And at least one of these is true:
Industry is Energy, Finance, or Technology
Or all of these are true:
Industry is Manufacturing
Employees is greater than 1,000
And NOT (Account Type is "Prospect" and Account Type is "Other")
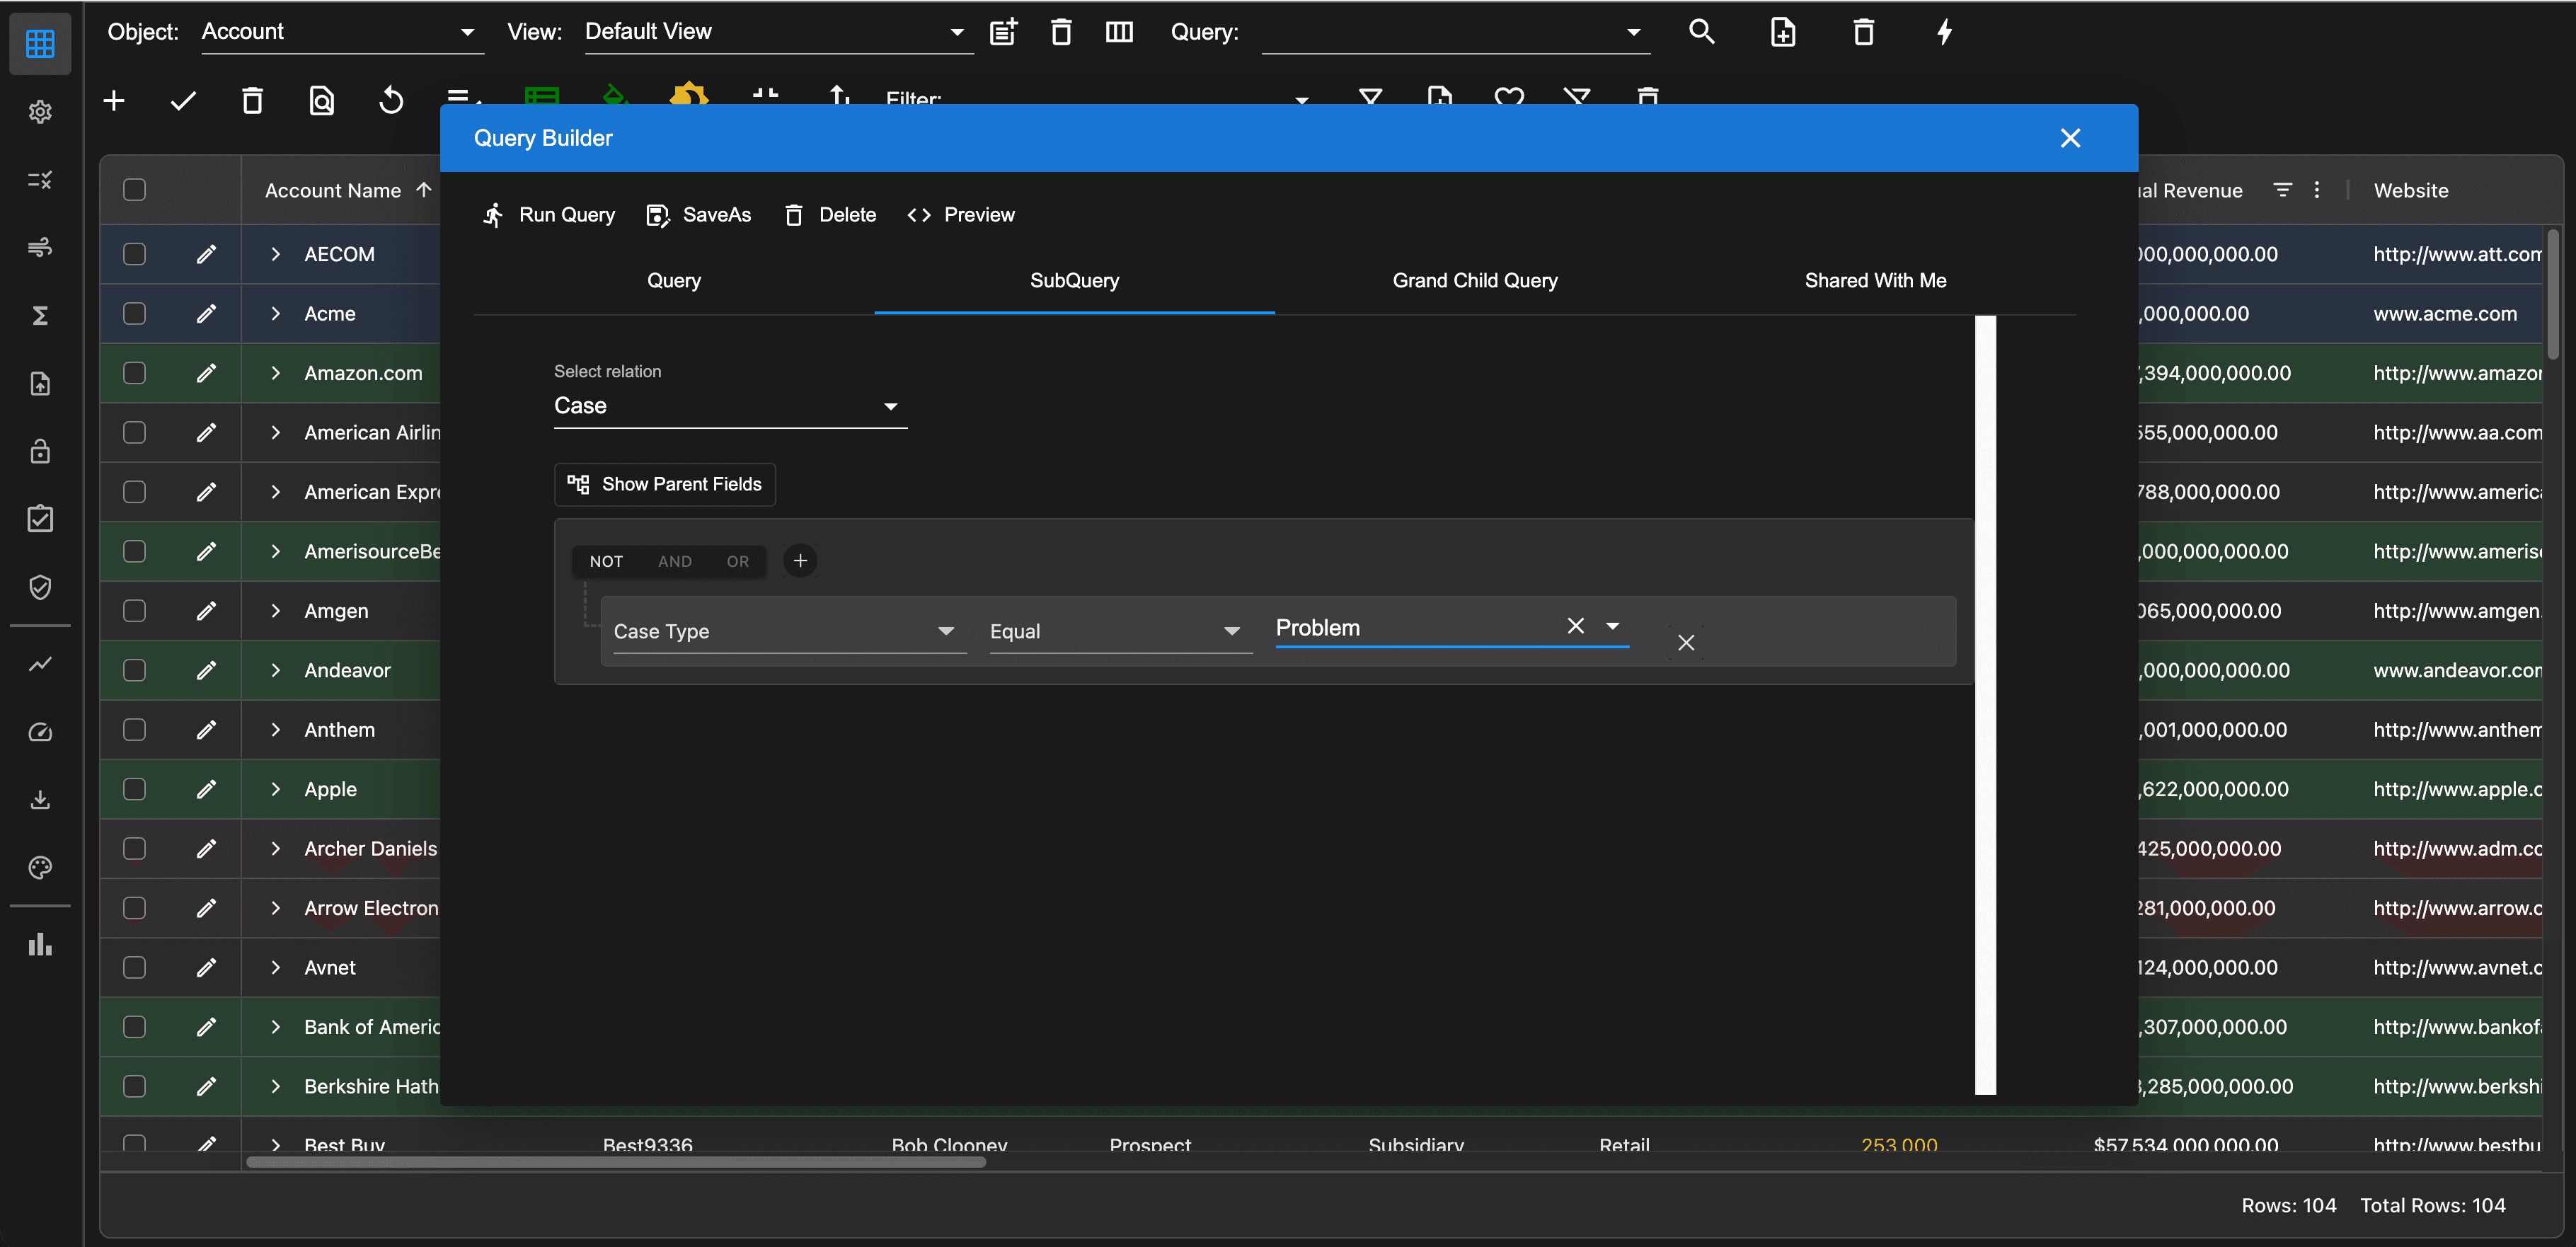
We could add a subquery by clicking the SubQuery tab. Select the relation from the dropdown and then add your subquery rule as required.
In a similar fashion, we can create a grandchild query. If defined, the result is a 3 level hierarchical query.
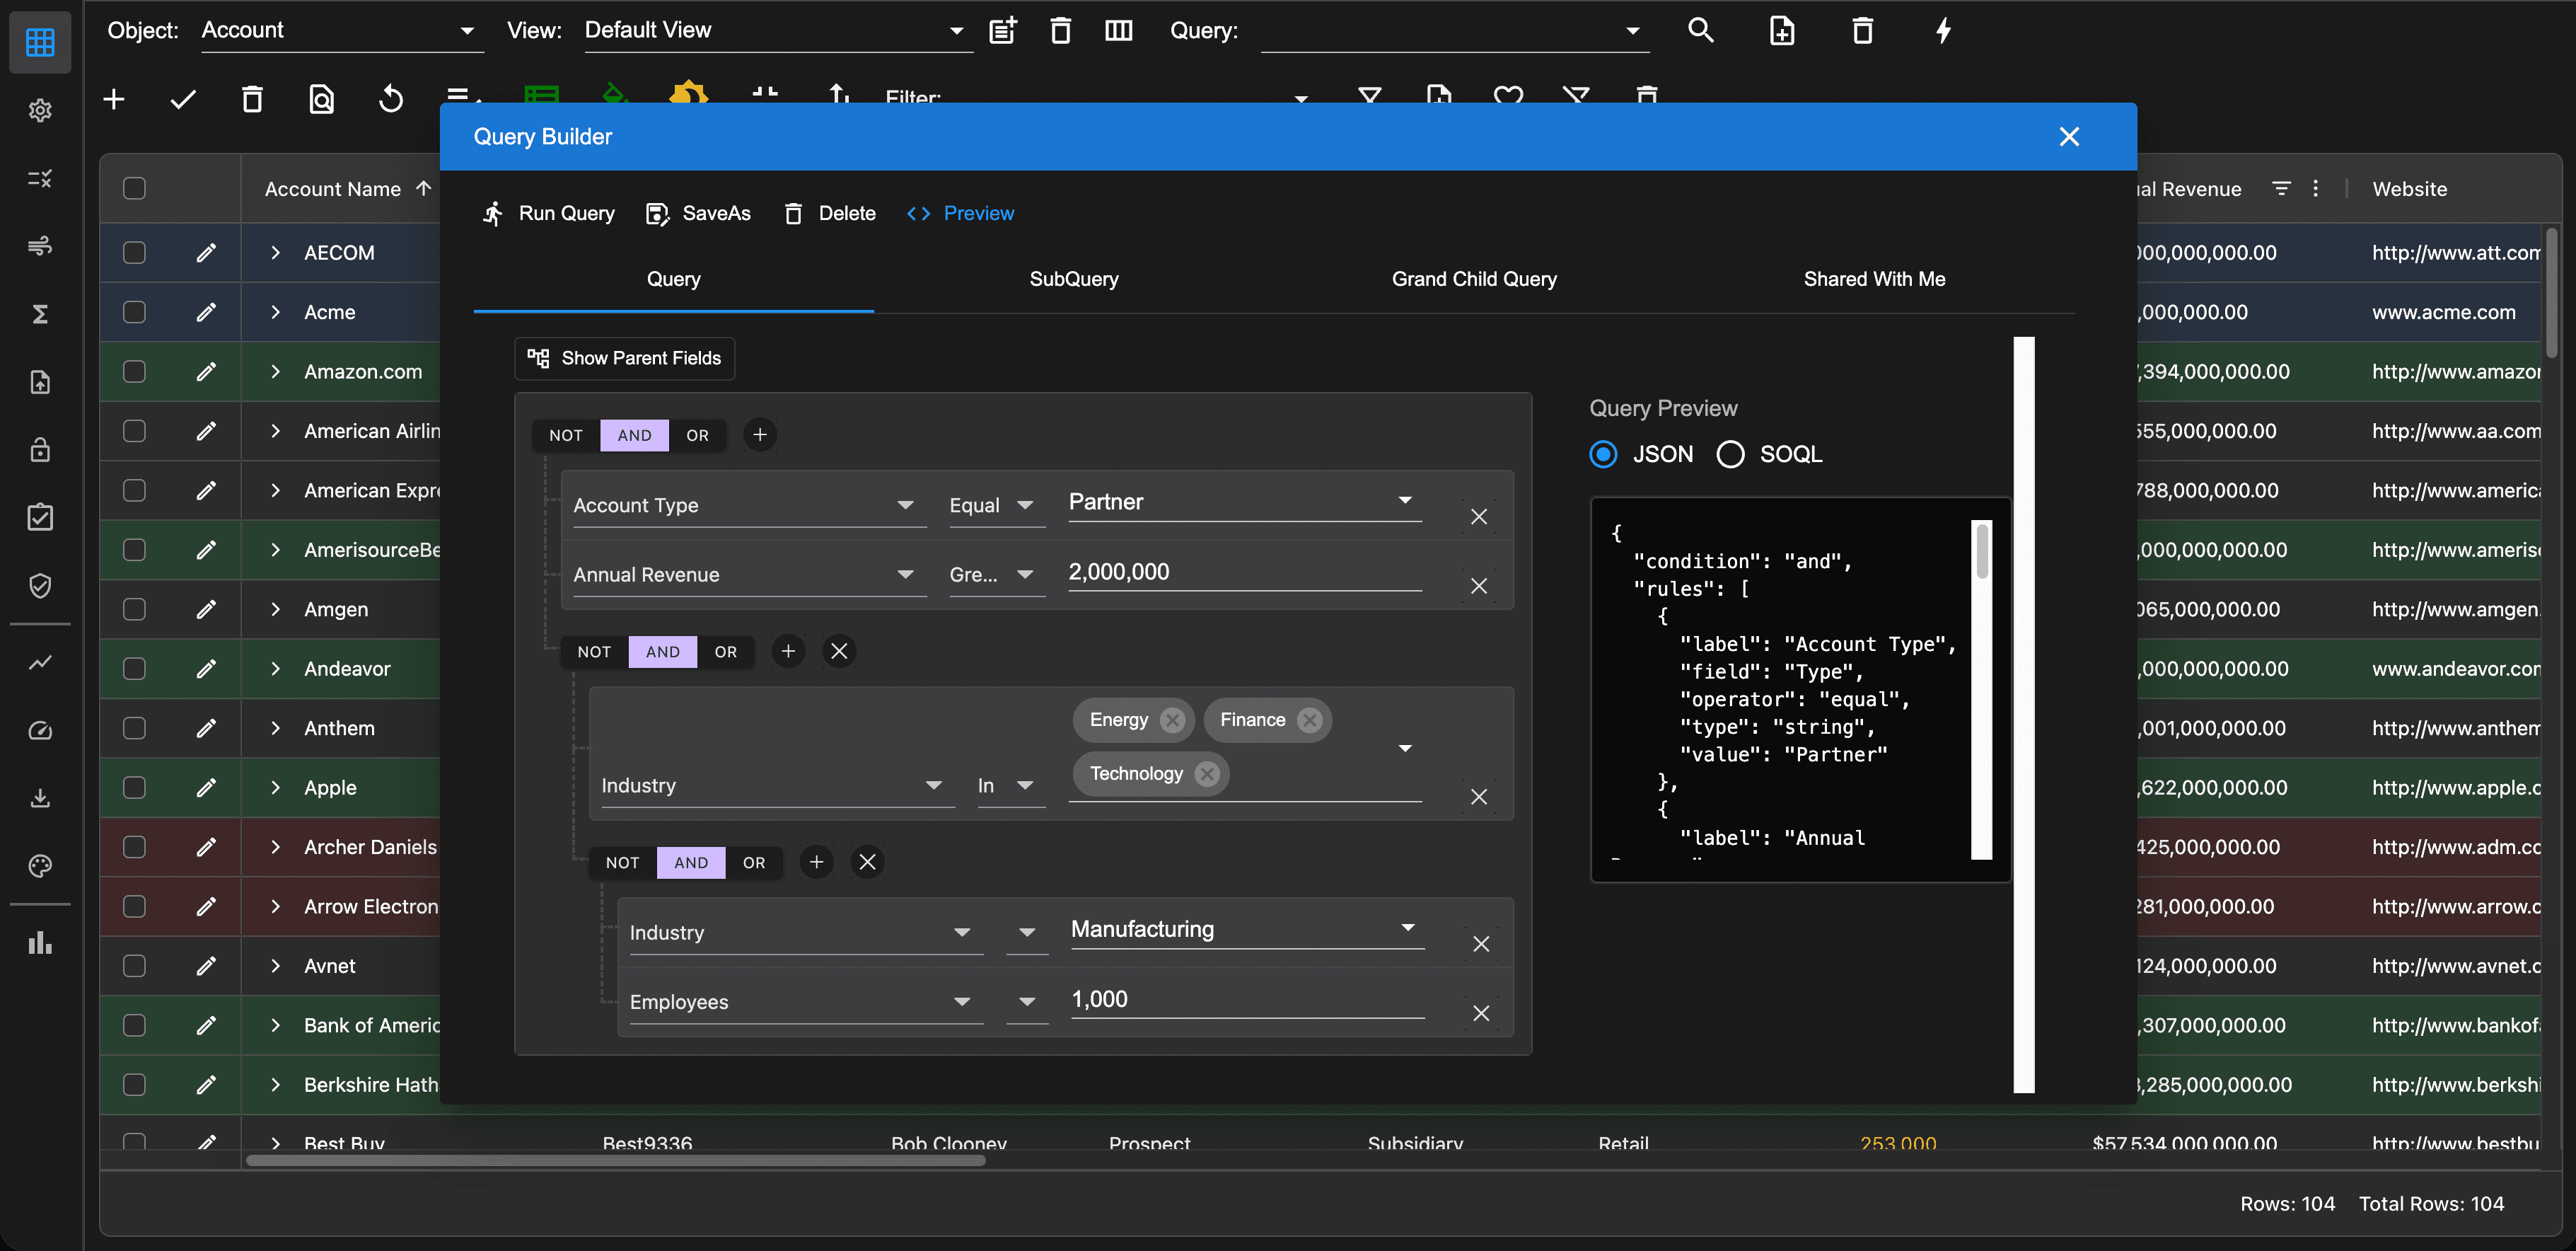
The QueryBuilder provides the ability to preview the query rule in either JSON or SOQL format. This helps users understand how their query rule will be executed. Click the preview button to see this information.
After making changes to the query logic, we can click the Run Query button to execute the query. Choosing this option will not update the selected query.
Clicking the Save button will update the selected query and execute the query.
Clicking the Save As button will create a new query, make that the selected query and execute the query.
Clicking the Delete button will delete the query.
Pinning rows
AppGrid provides the ability to pin rows. Pinned rows appear either above or below the normal rows of a table. This is sometimes also known as Frozen Rows or Floating Rows. Pinned rows are a useful feature that allows you to quickly find rows of high interest. Rows can be pinned via the context menu.
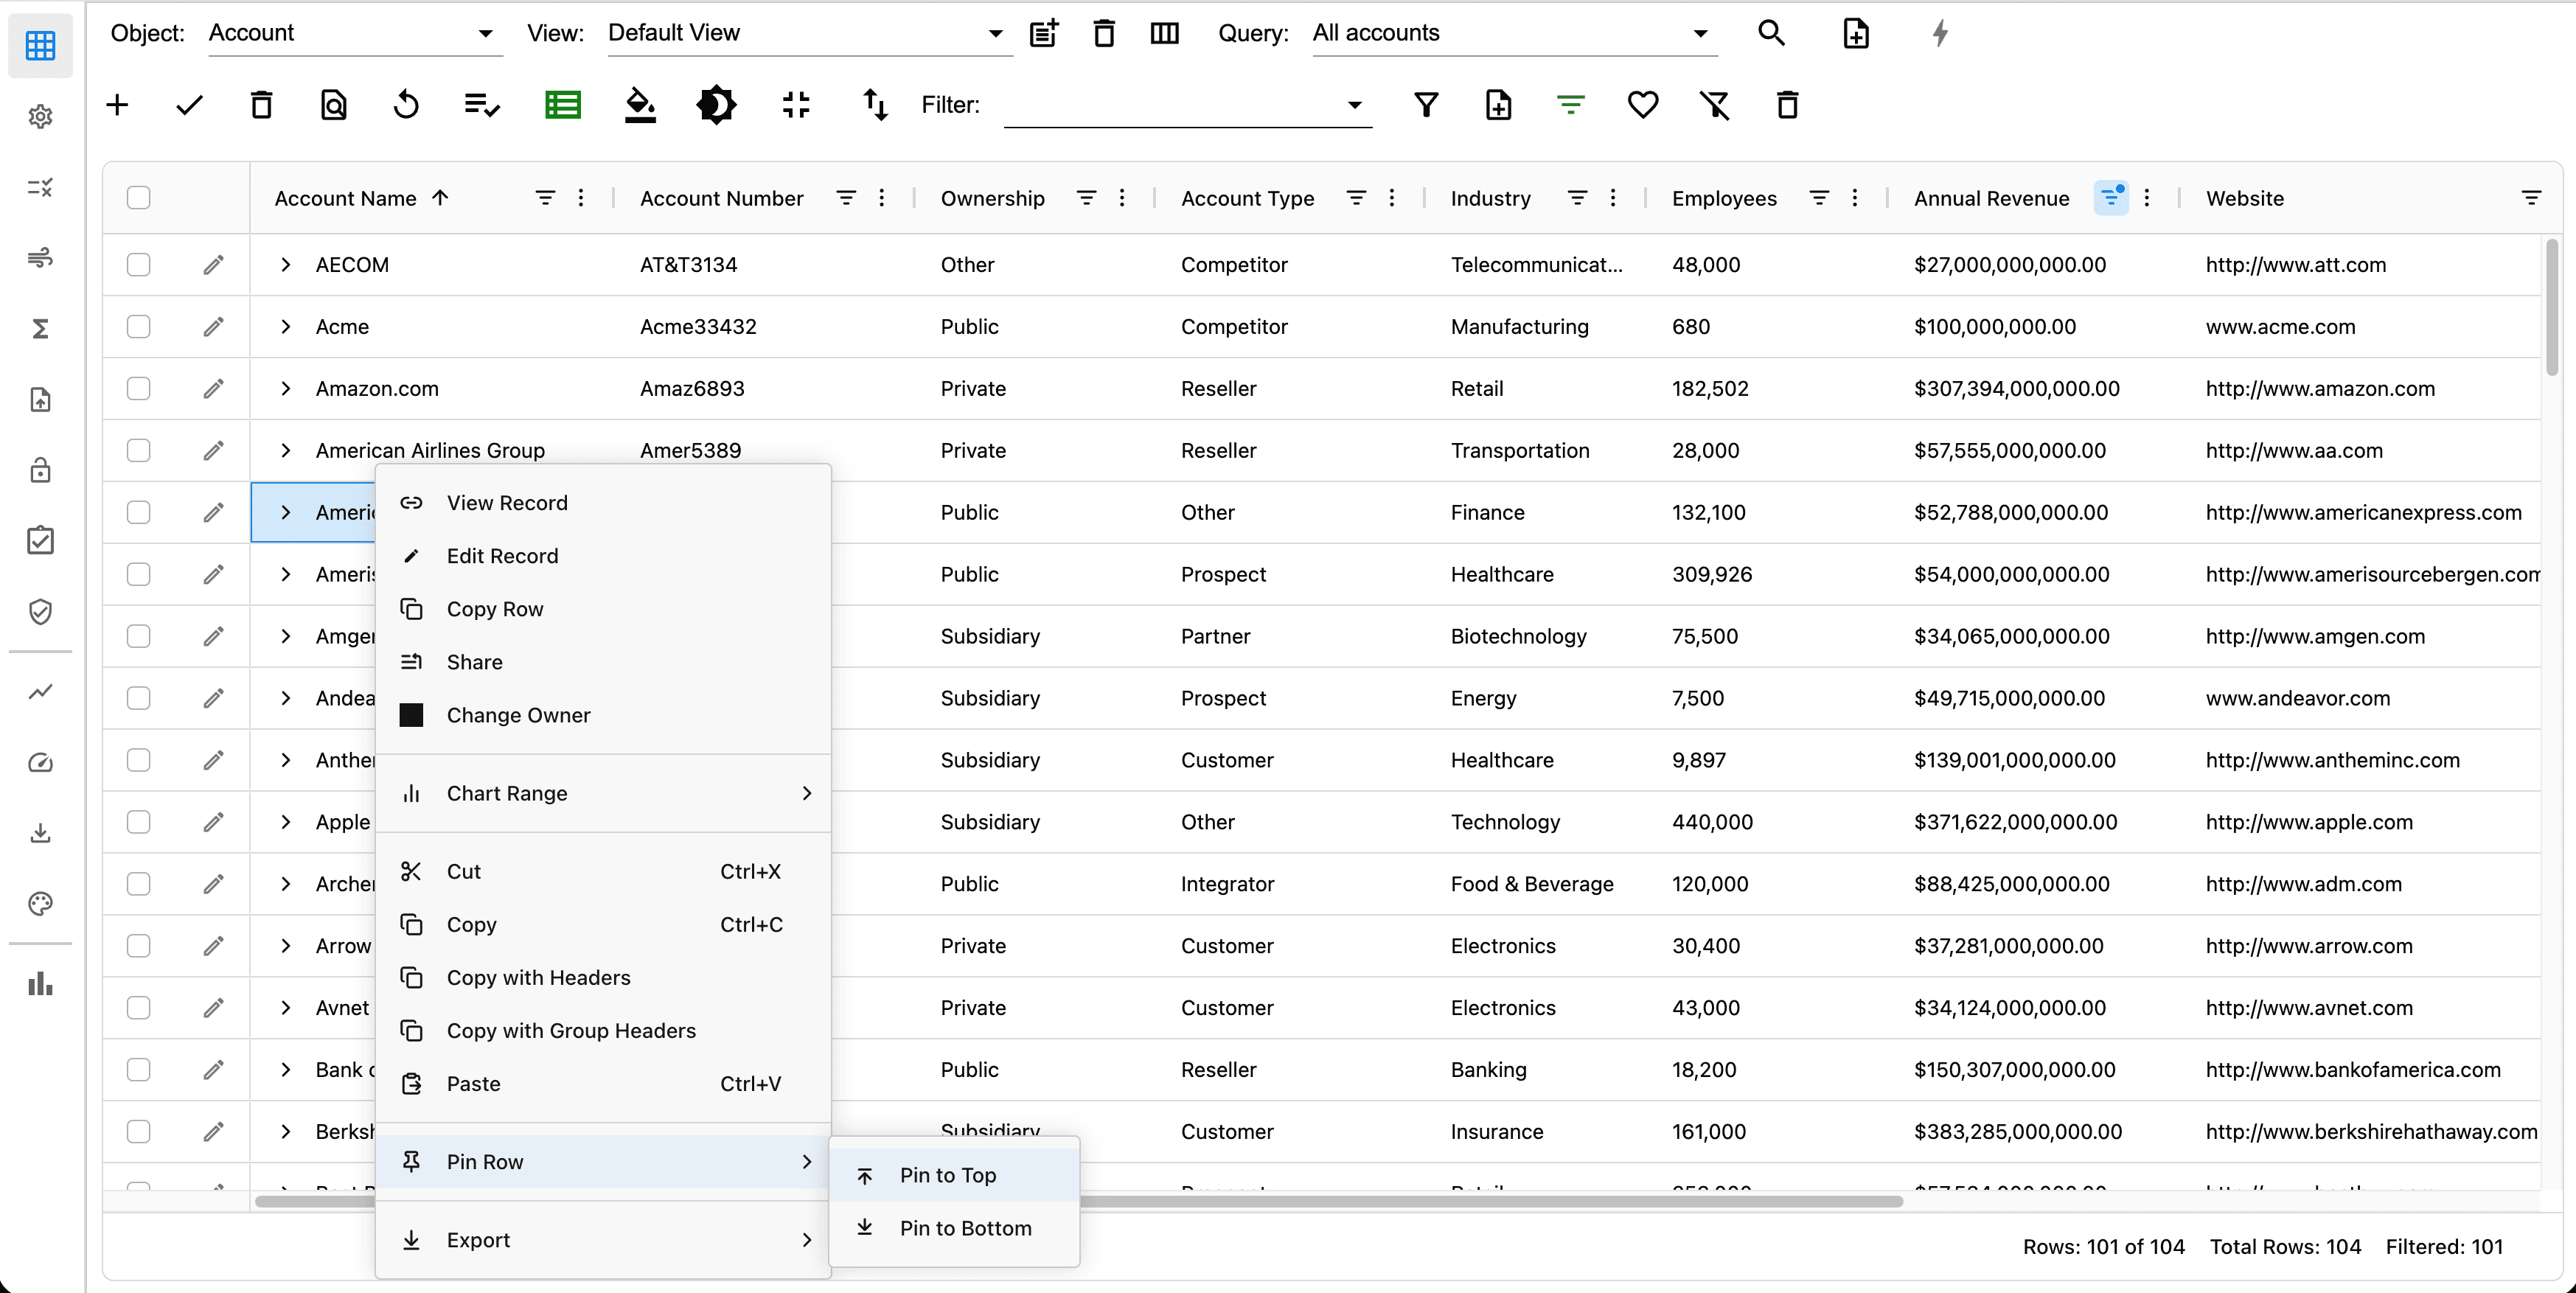
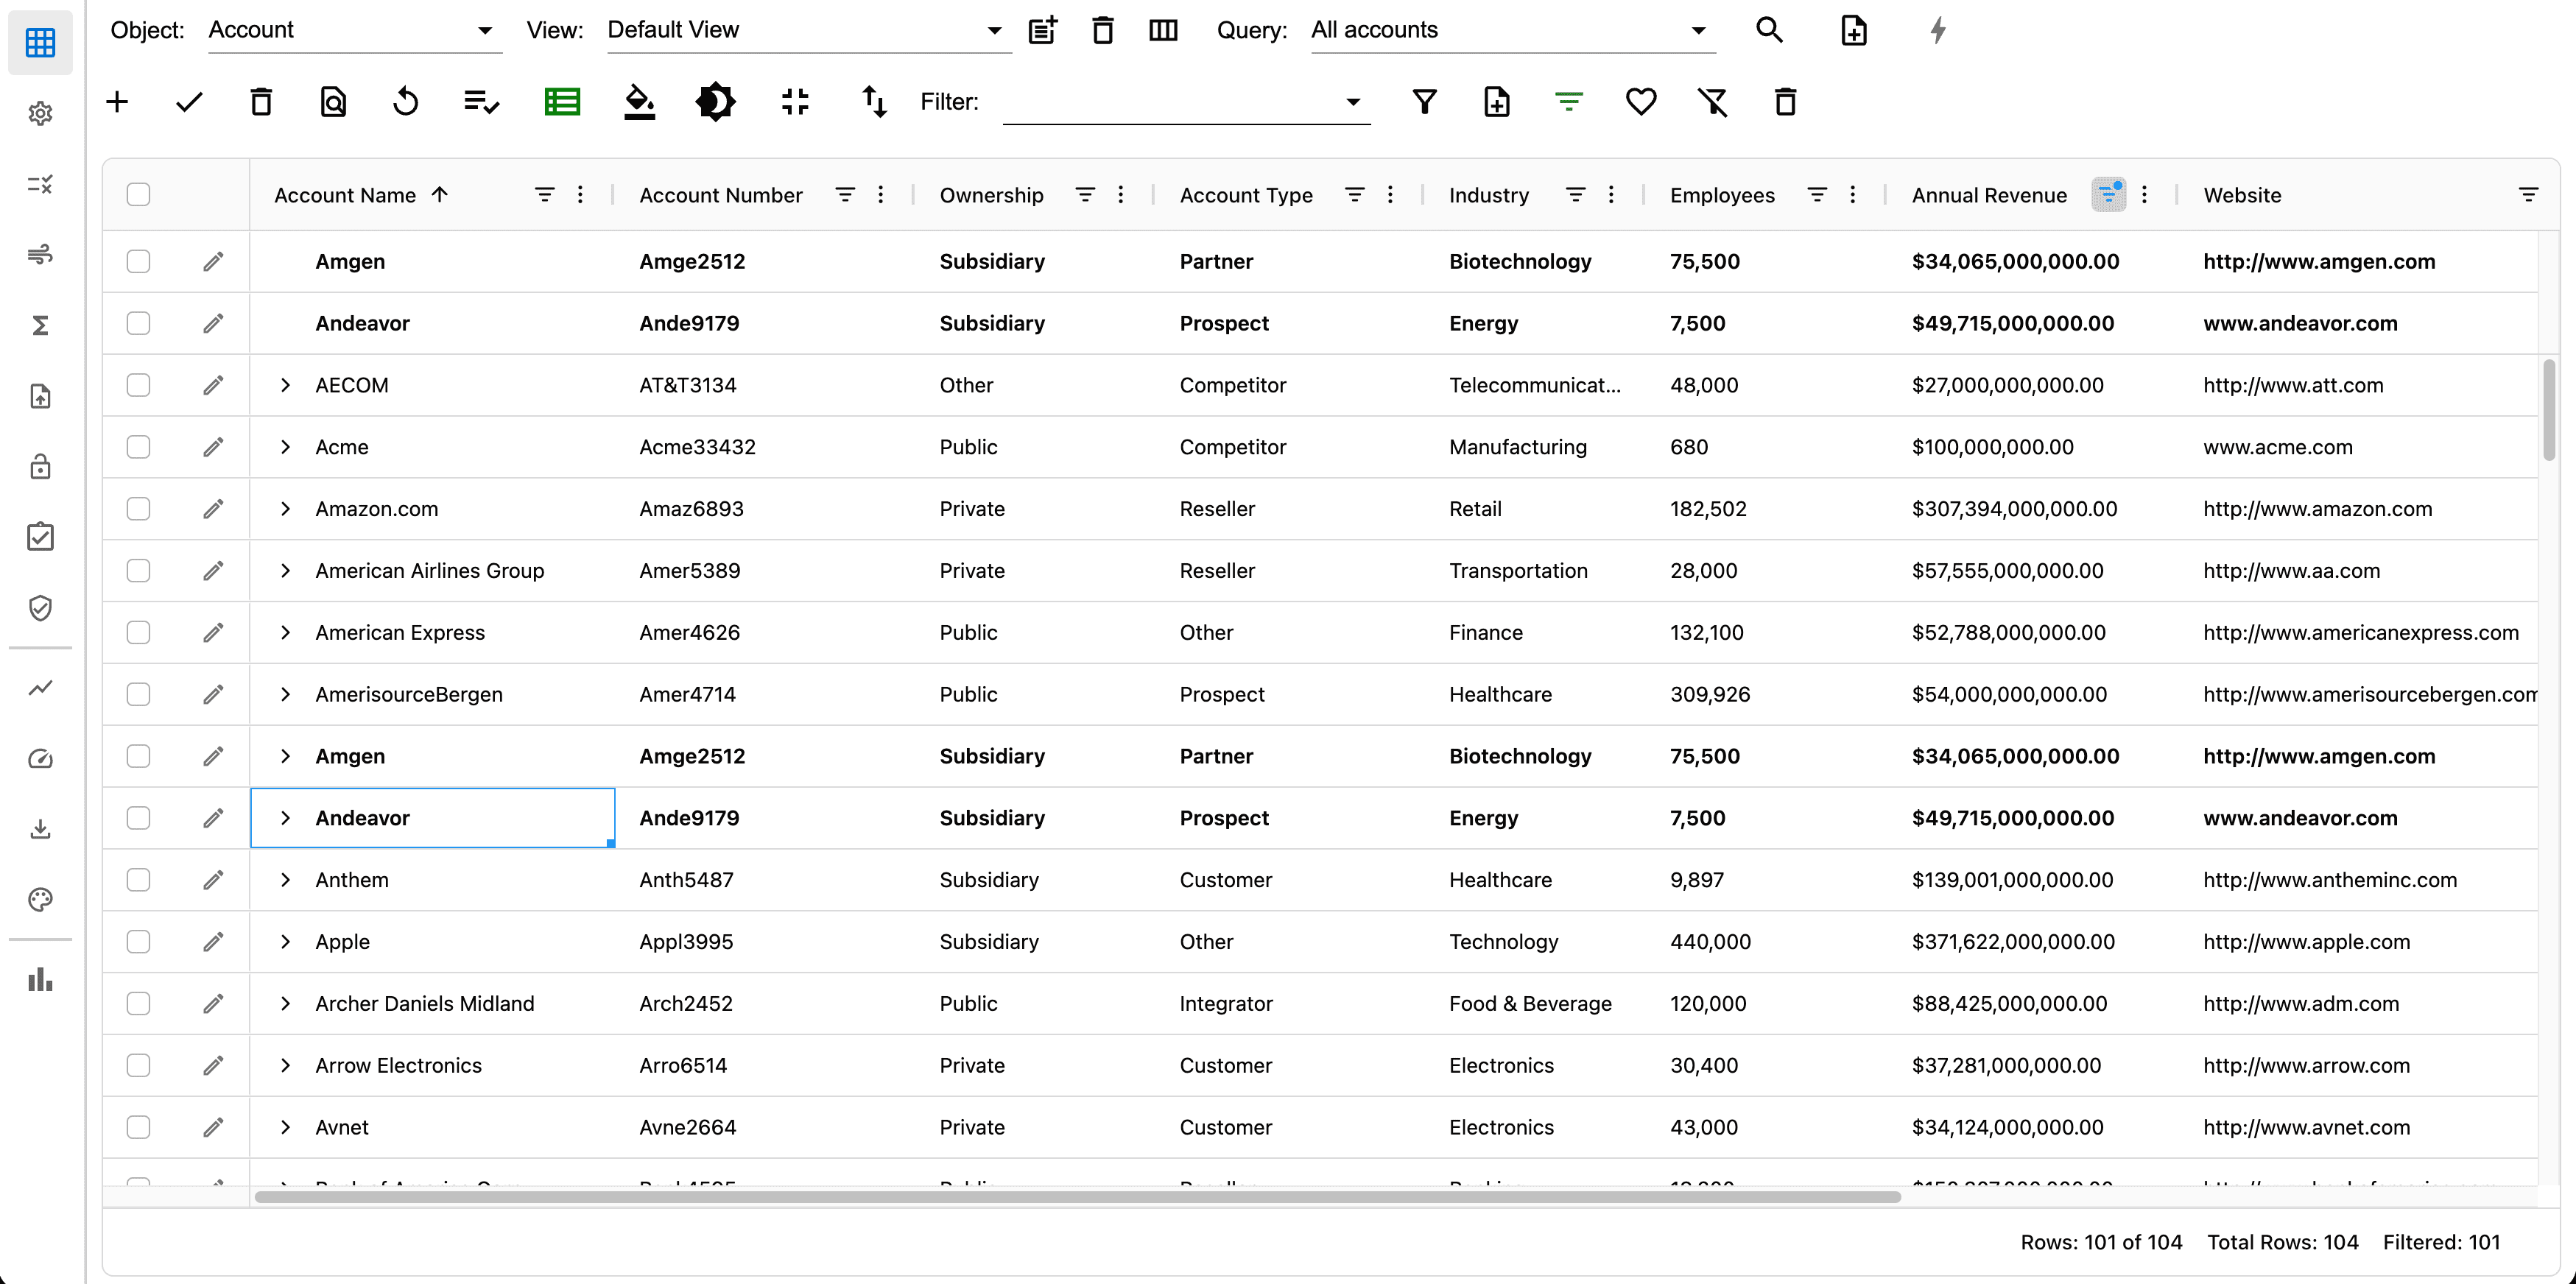
Pinned rows are styled in bold. In the example below, the top 2 rows are pinned. To unpin a row, right click on the record and select Unpin.
Viewing Salesforce record
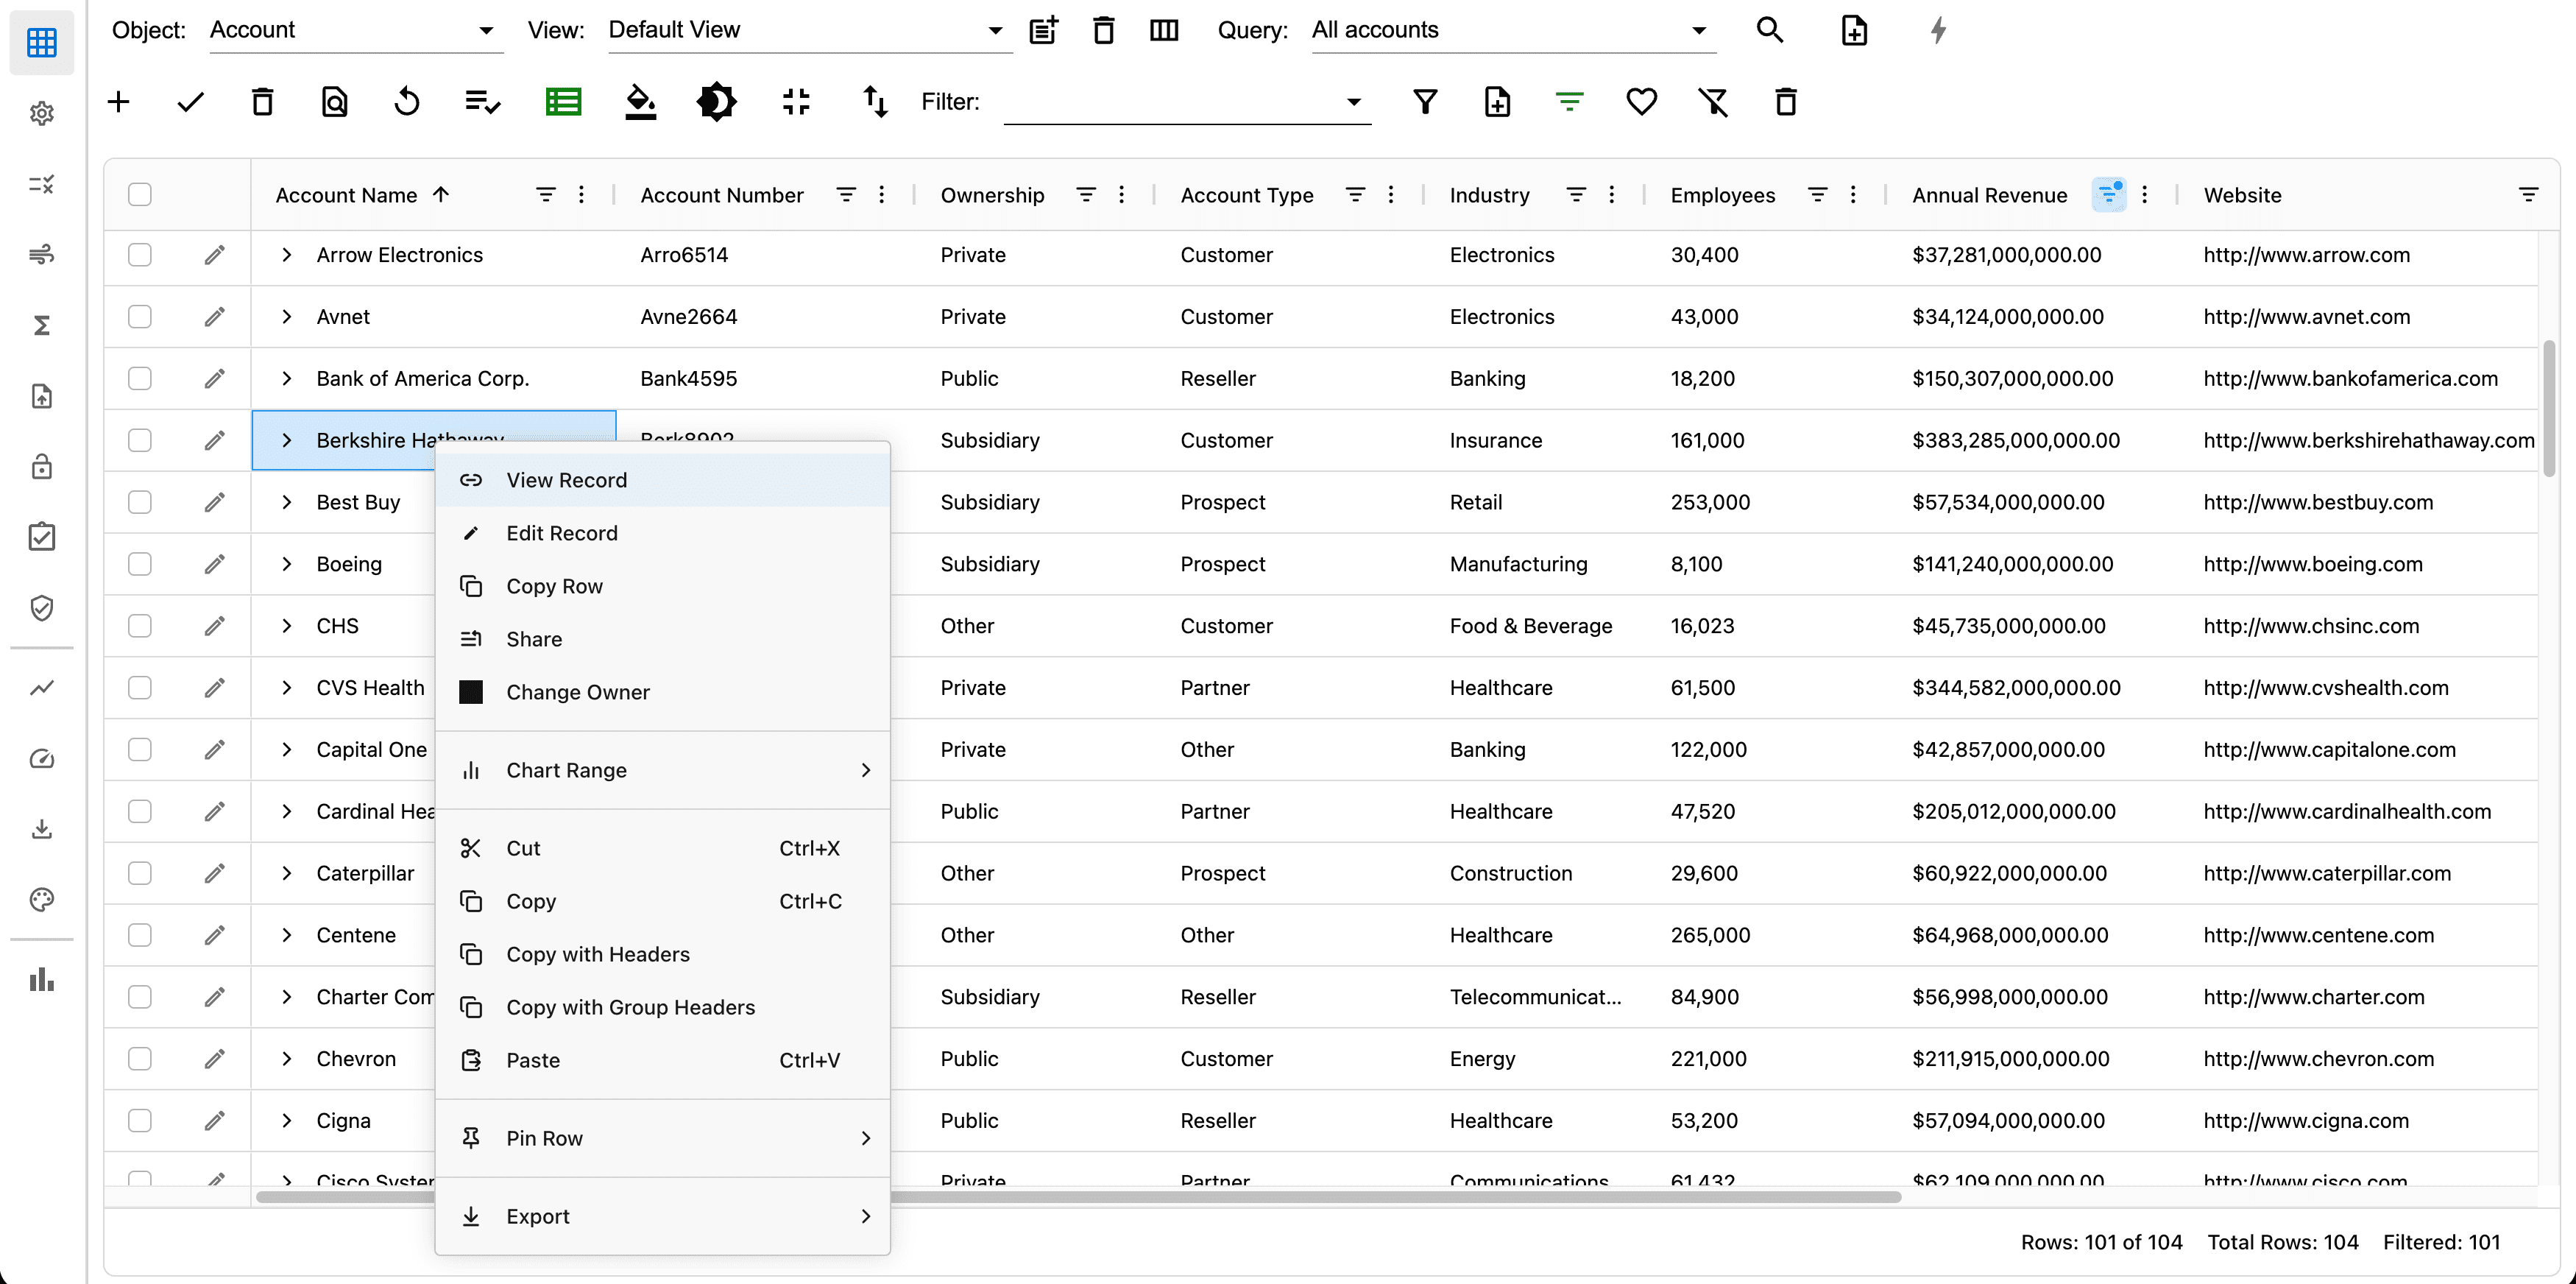
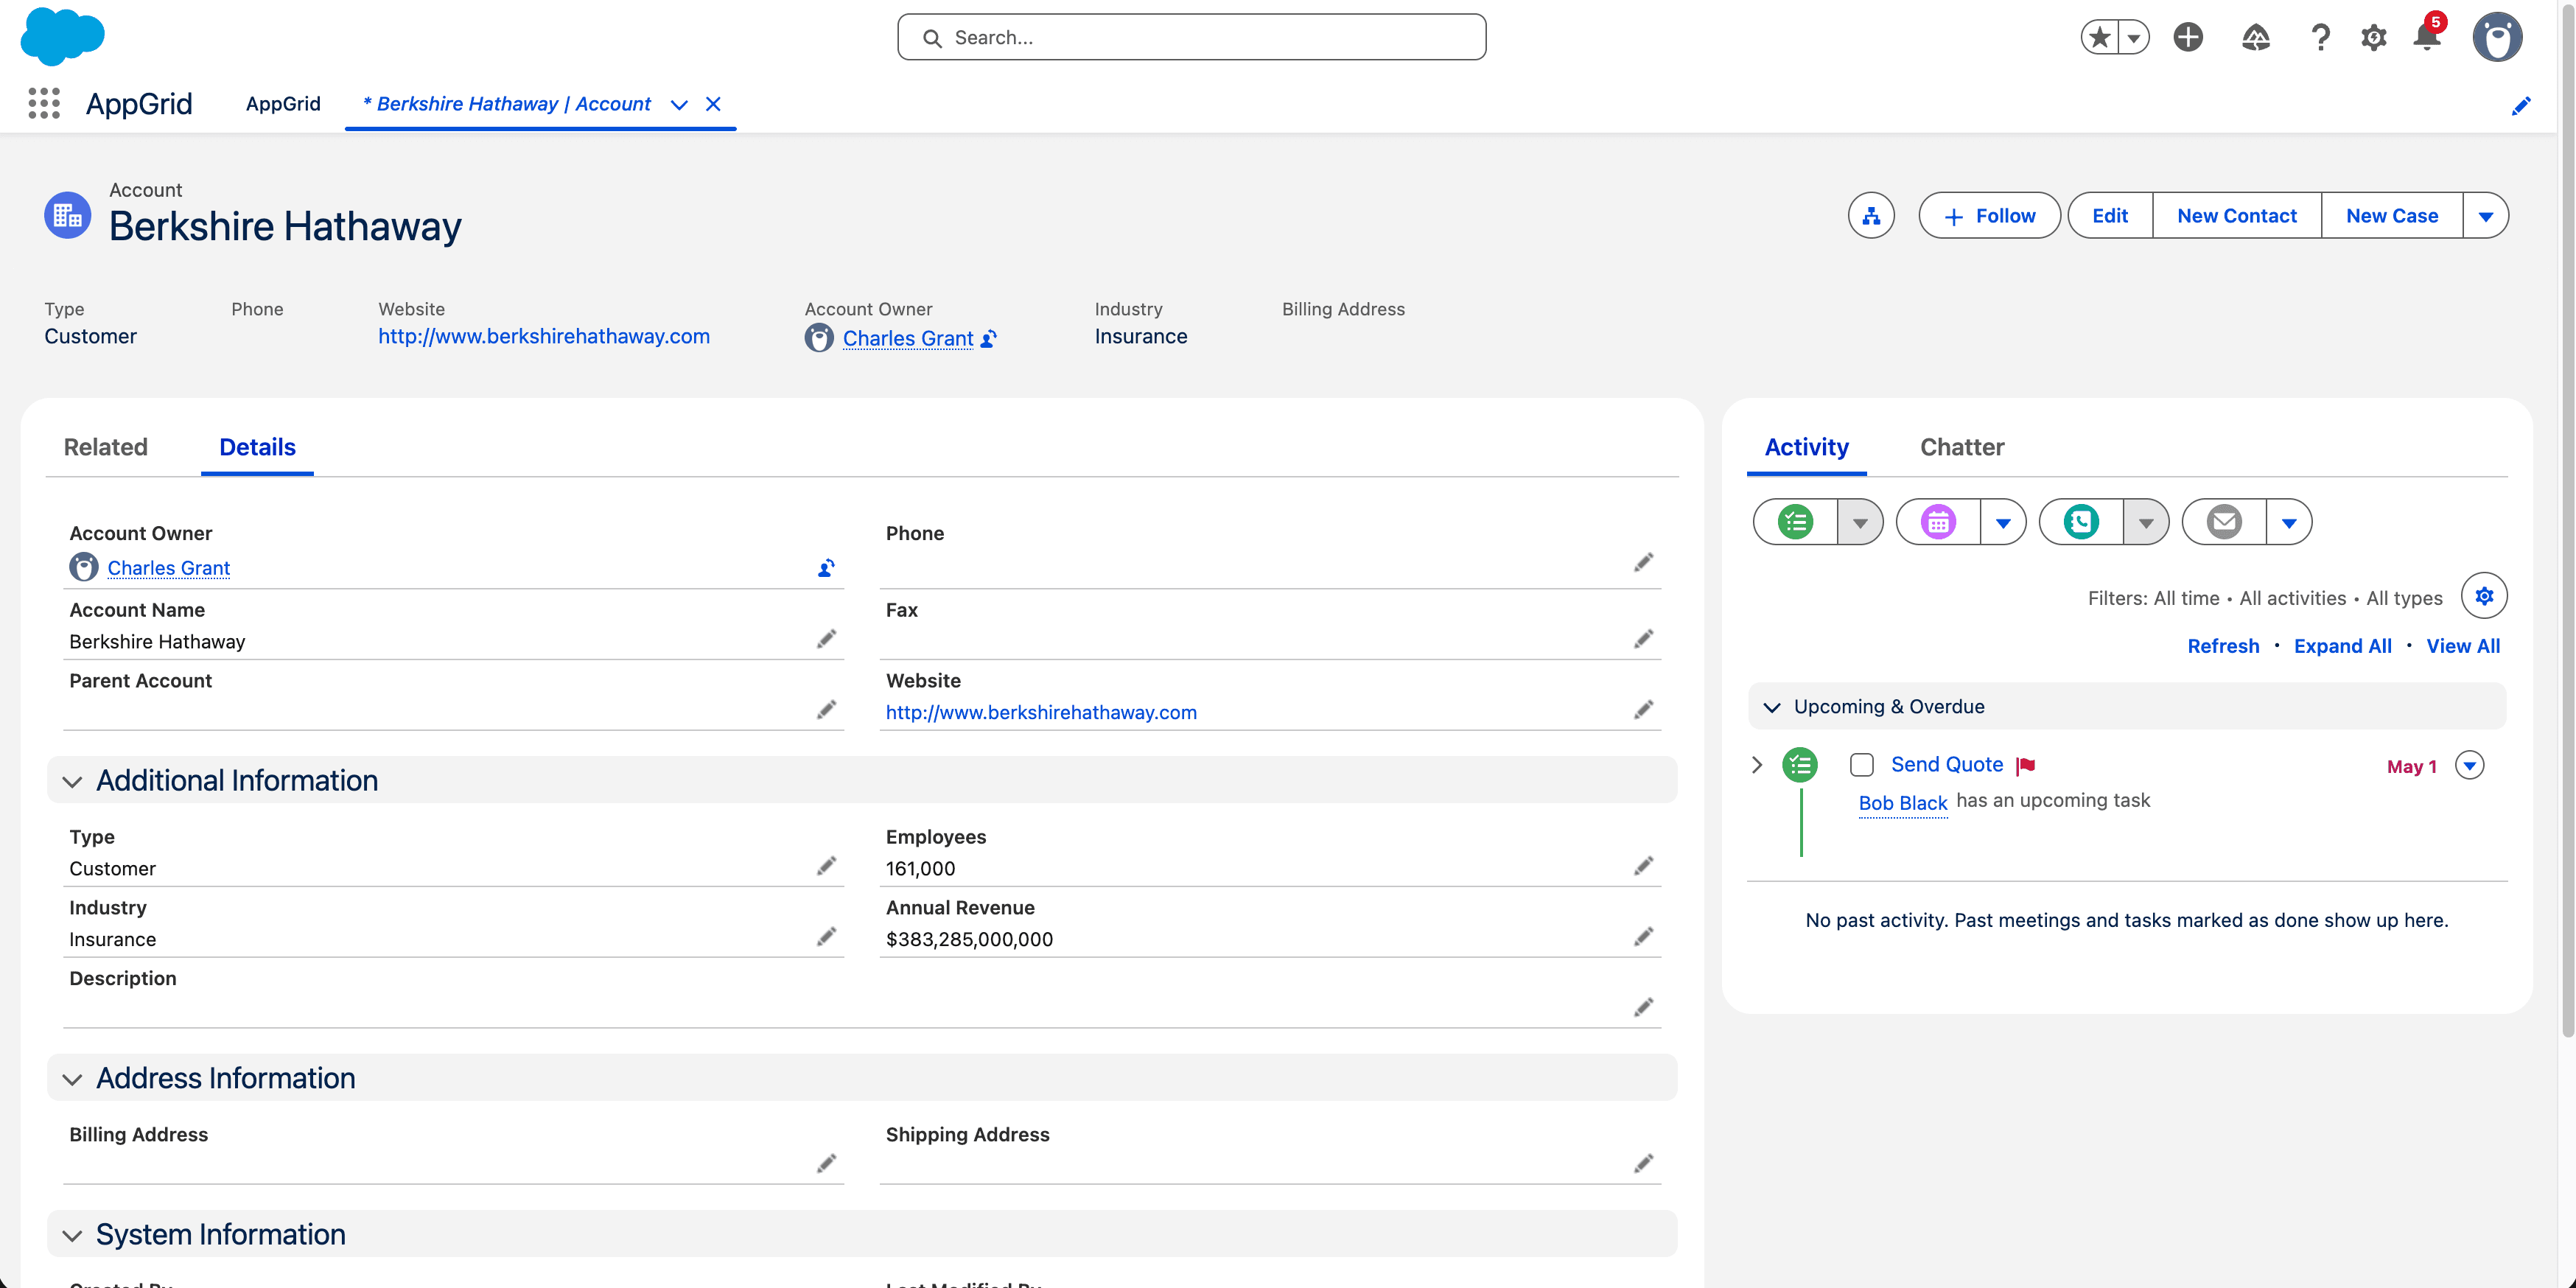
AppGrid provides the ability to view the associated Salesforce record. Right-click on any record and select 'View Record'. The Salesforce record page will open in a new tab.
Sharing records
AppGrid supports record sharing. Right-click on any record and select 'Share. The sharing dialog will open that allows you to select the user to receive the share.
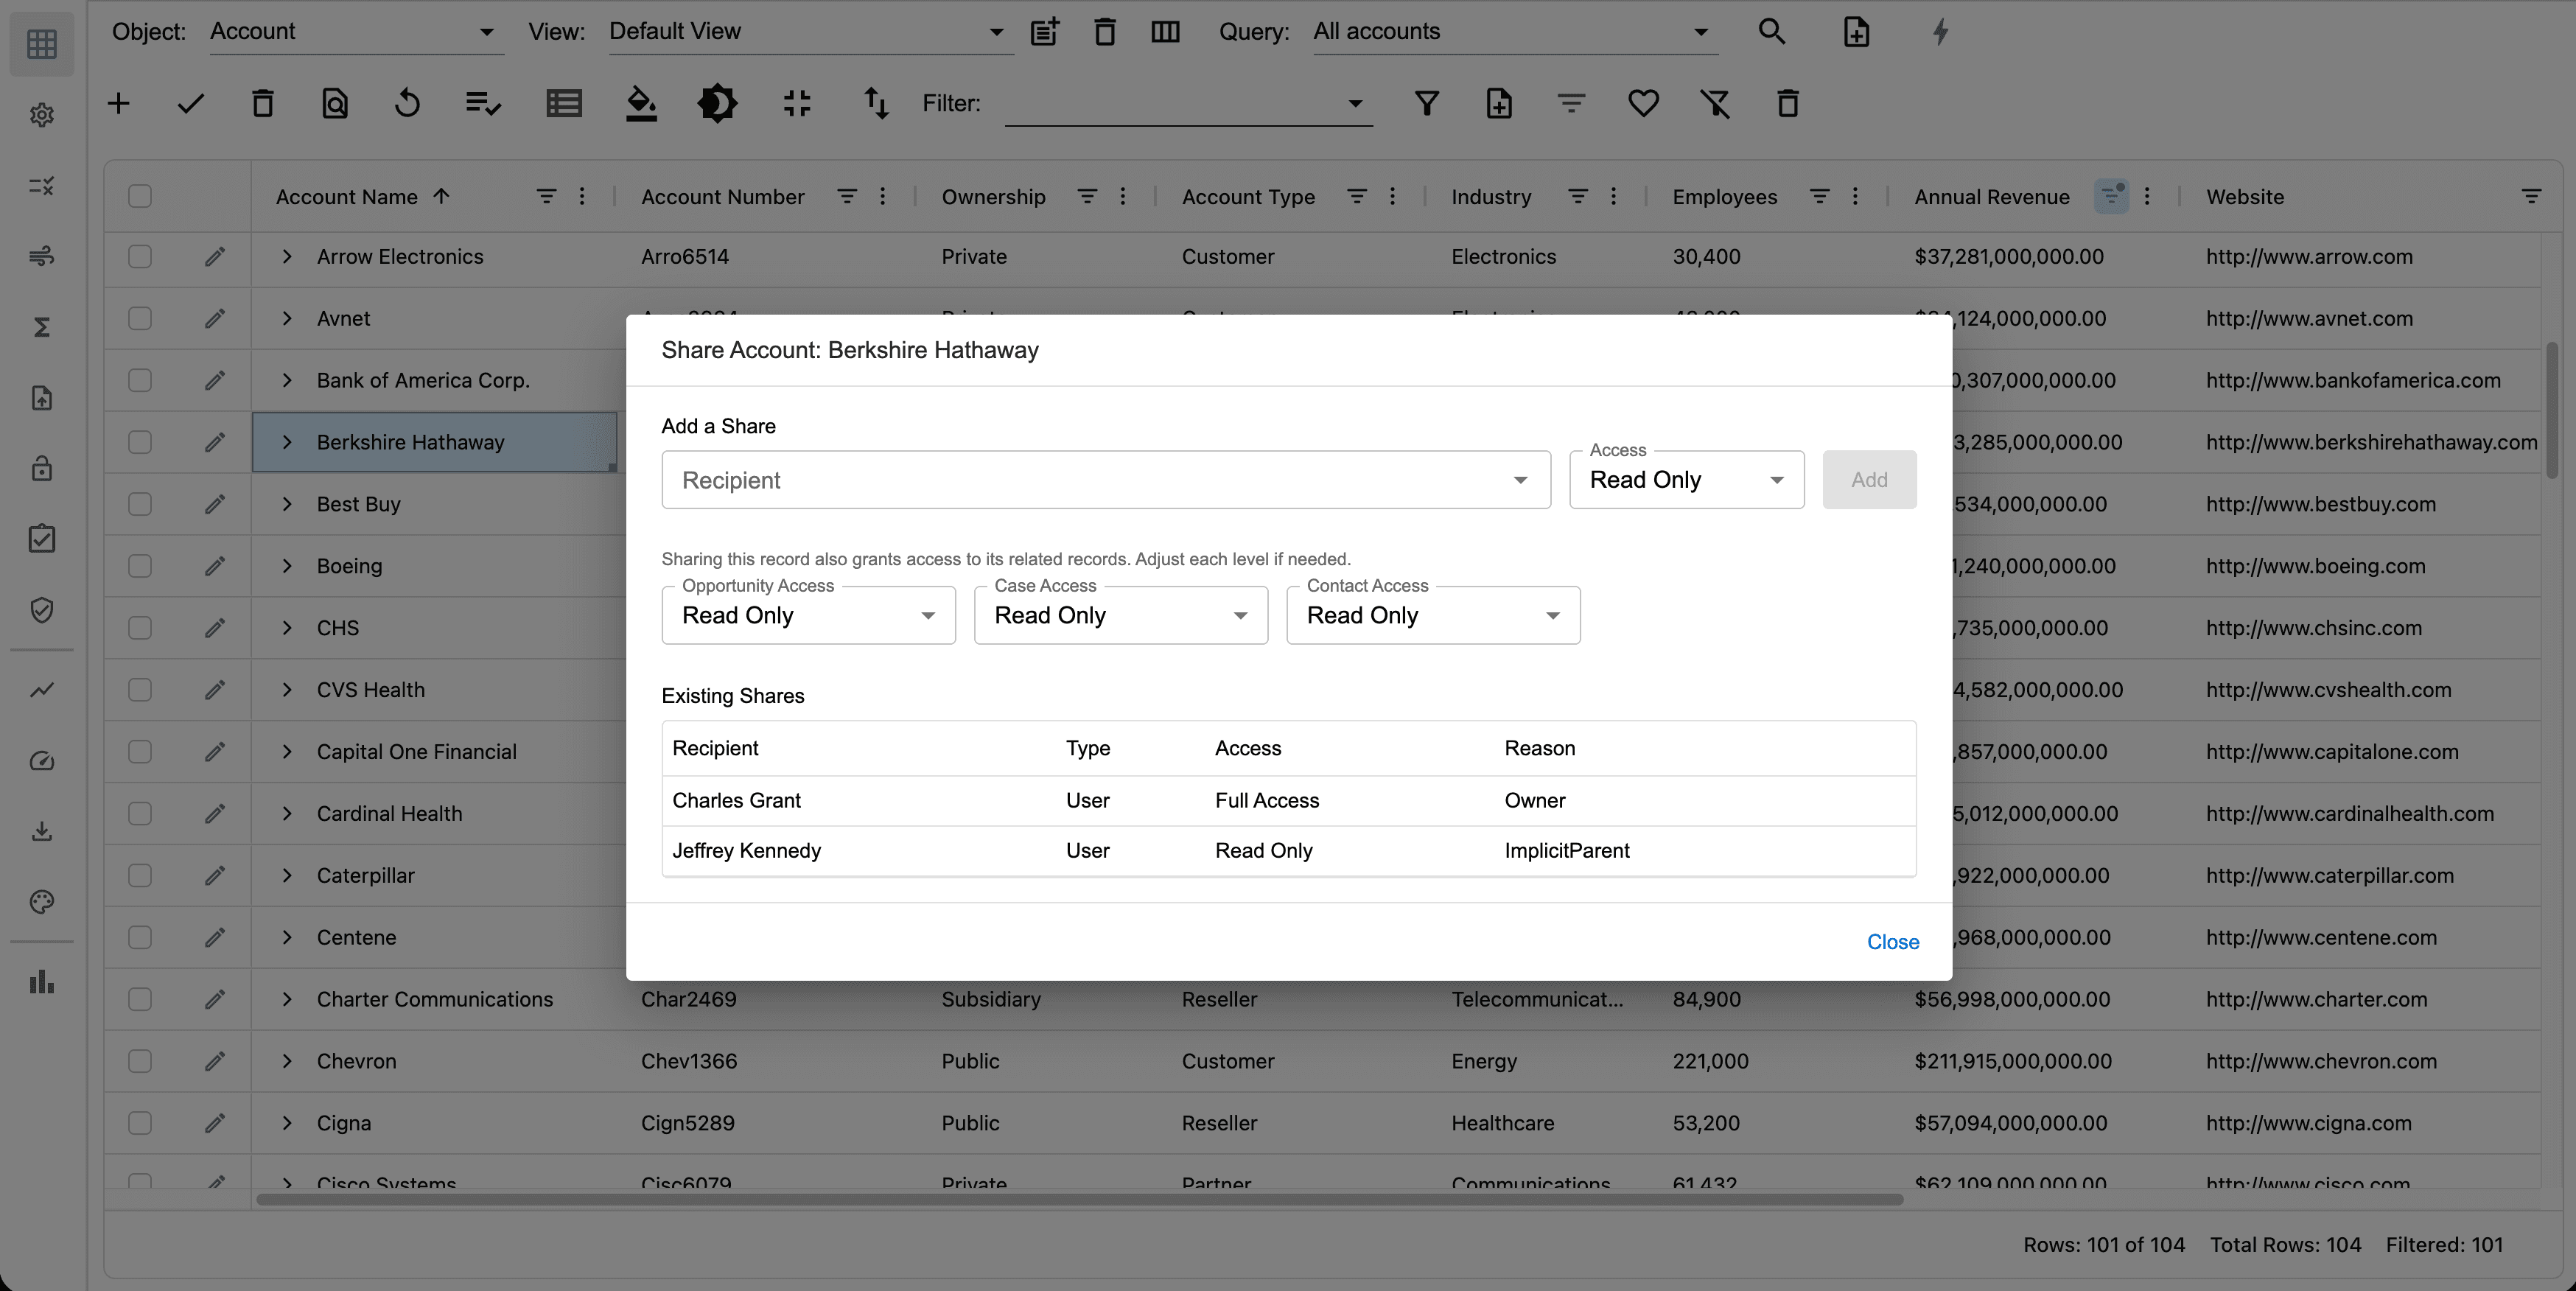
Select the Access mode for the the parent object being shared. Below the selected user, the dialog provides the ability to set the Access for each child object (defaults to parent Access mode). The existing shares for the object are displayed for reference. Click the Add button to create the share. The sharing section will be updated to display the new share. Click the close button.
Managing approvals
AppGrid provides a highly optimized view for managing approvals. See the Approvals view for more information.
Creating row & column styles
AppGrid provides the ability to create styles for rows and columns. A style is scoped to the selected object and view.
This ability turns data into information by highlighting values that we want to alert the user to. In the image below, we have created a row style to highlight records where the Industry = Healthcare Insurance AND where the AccountType = Customer Channel AND where the AnnualRevenue > 5B.
To create a style, click the grid toolbar More menu and select Format Wizard. The format panel will display the row and column formats that have been created and provide the ability to create, edit or delete styles. You can toggle the visibility of each style dynamically.
The format panel also a really nice feature to import styles. If the user had previously created styles for a different view (of the same selected object), they can import them into the current view which saves time. Clicking the import button will display a dialog which allows the user to select one or more previously defined styled.
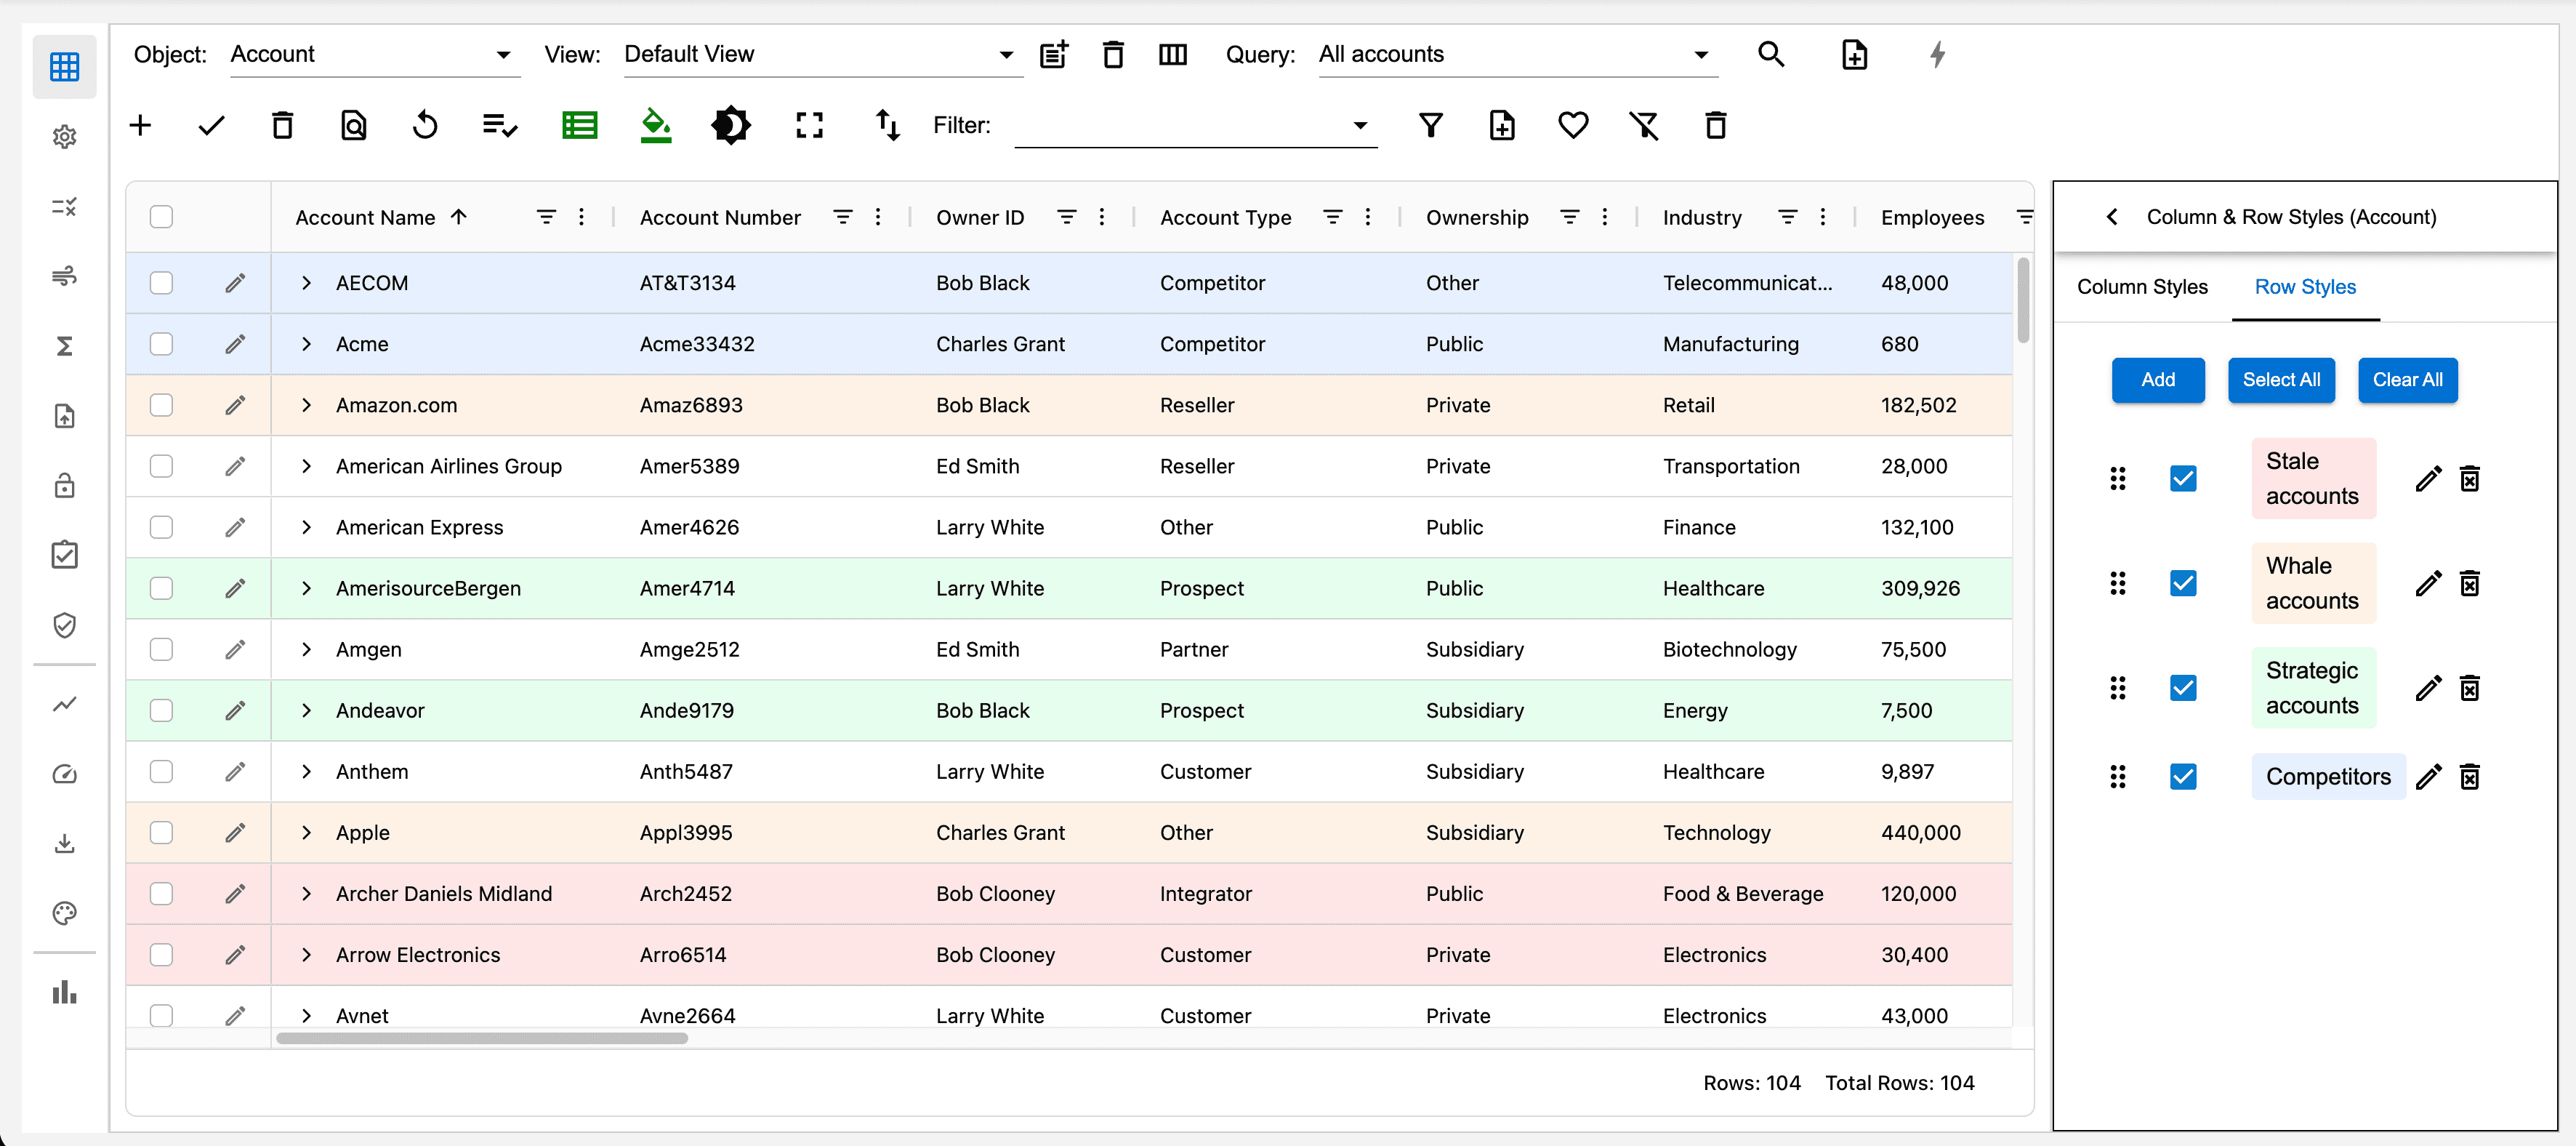
You can set the precedence of the styles by dragging them into the order you wish. This matters when more than one style will fire based on the row properties. The first style wins. So in the example below, the Stale accounts style will be used when the style condition is true even though other styles may also return true.
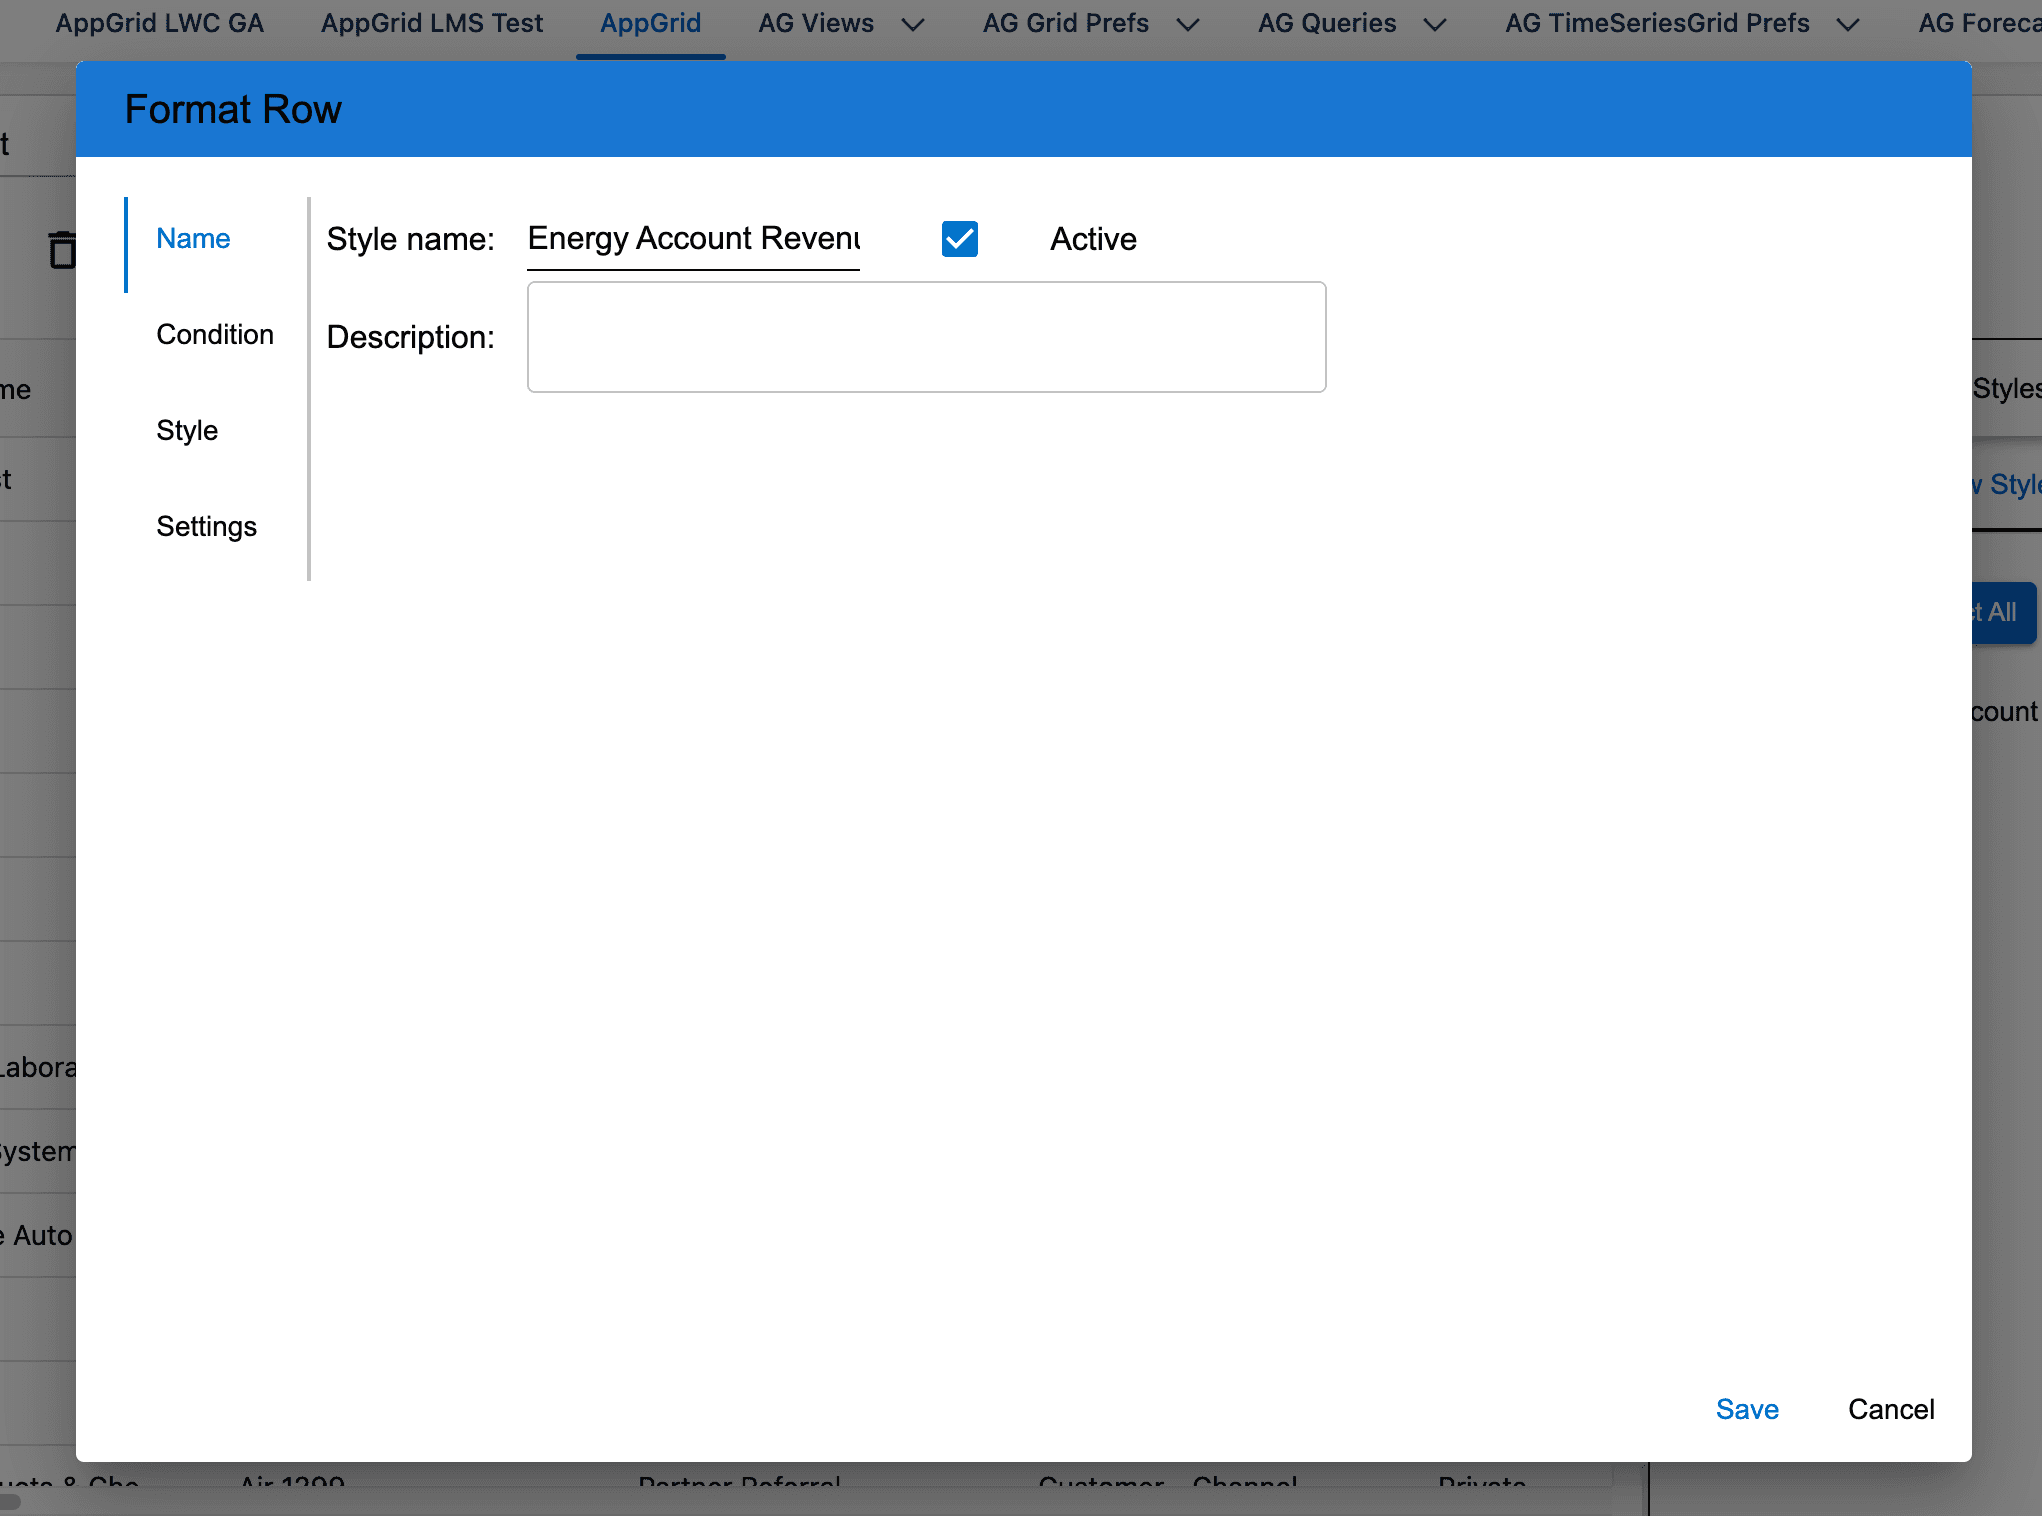
The process of creating a row or column style is very similar. Open the row style wizard by clicking the edit button.
Provide the name and description of the style.
Click on the Condition tab. The format row wizard allows you to create hierarchical rule expressions using AND/OR and group logic as shown in the example below.
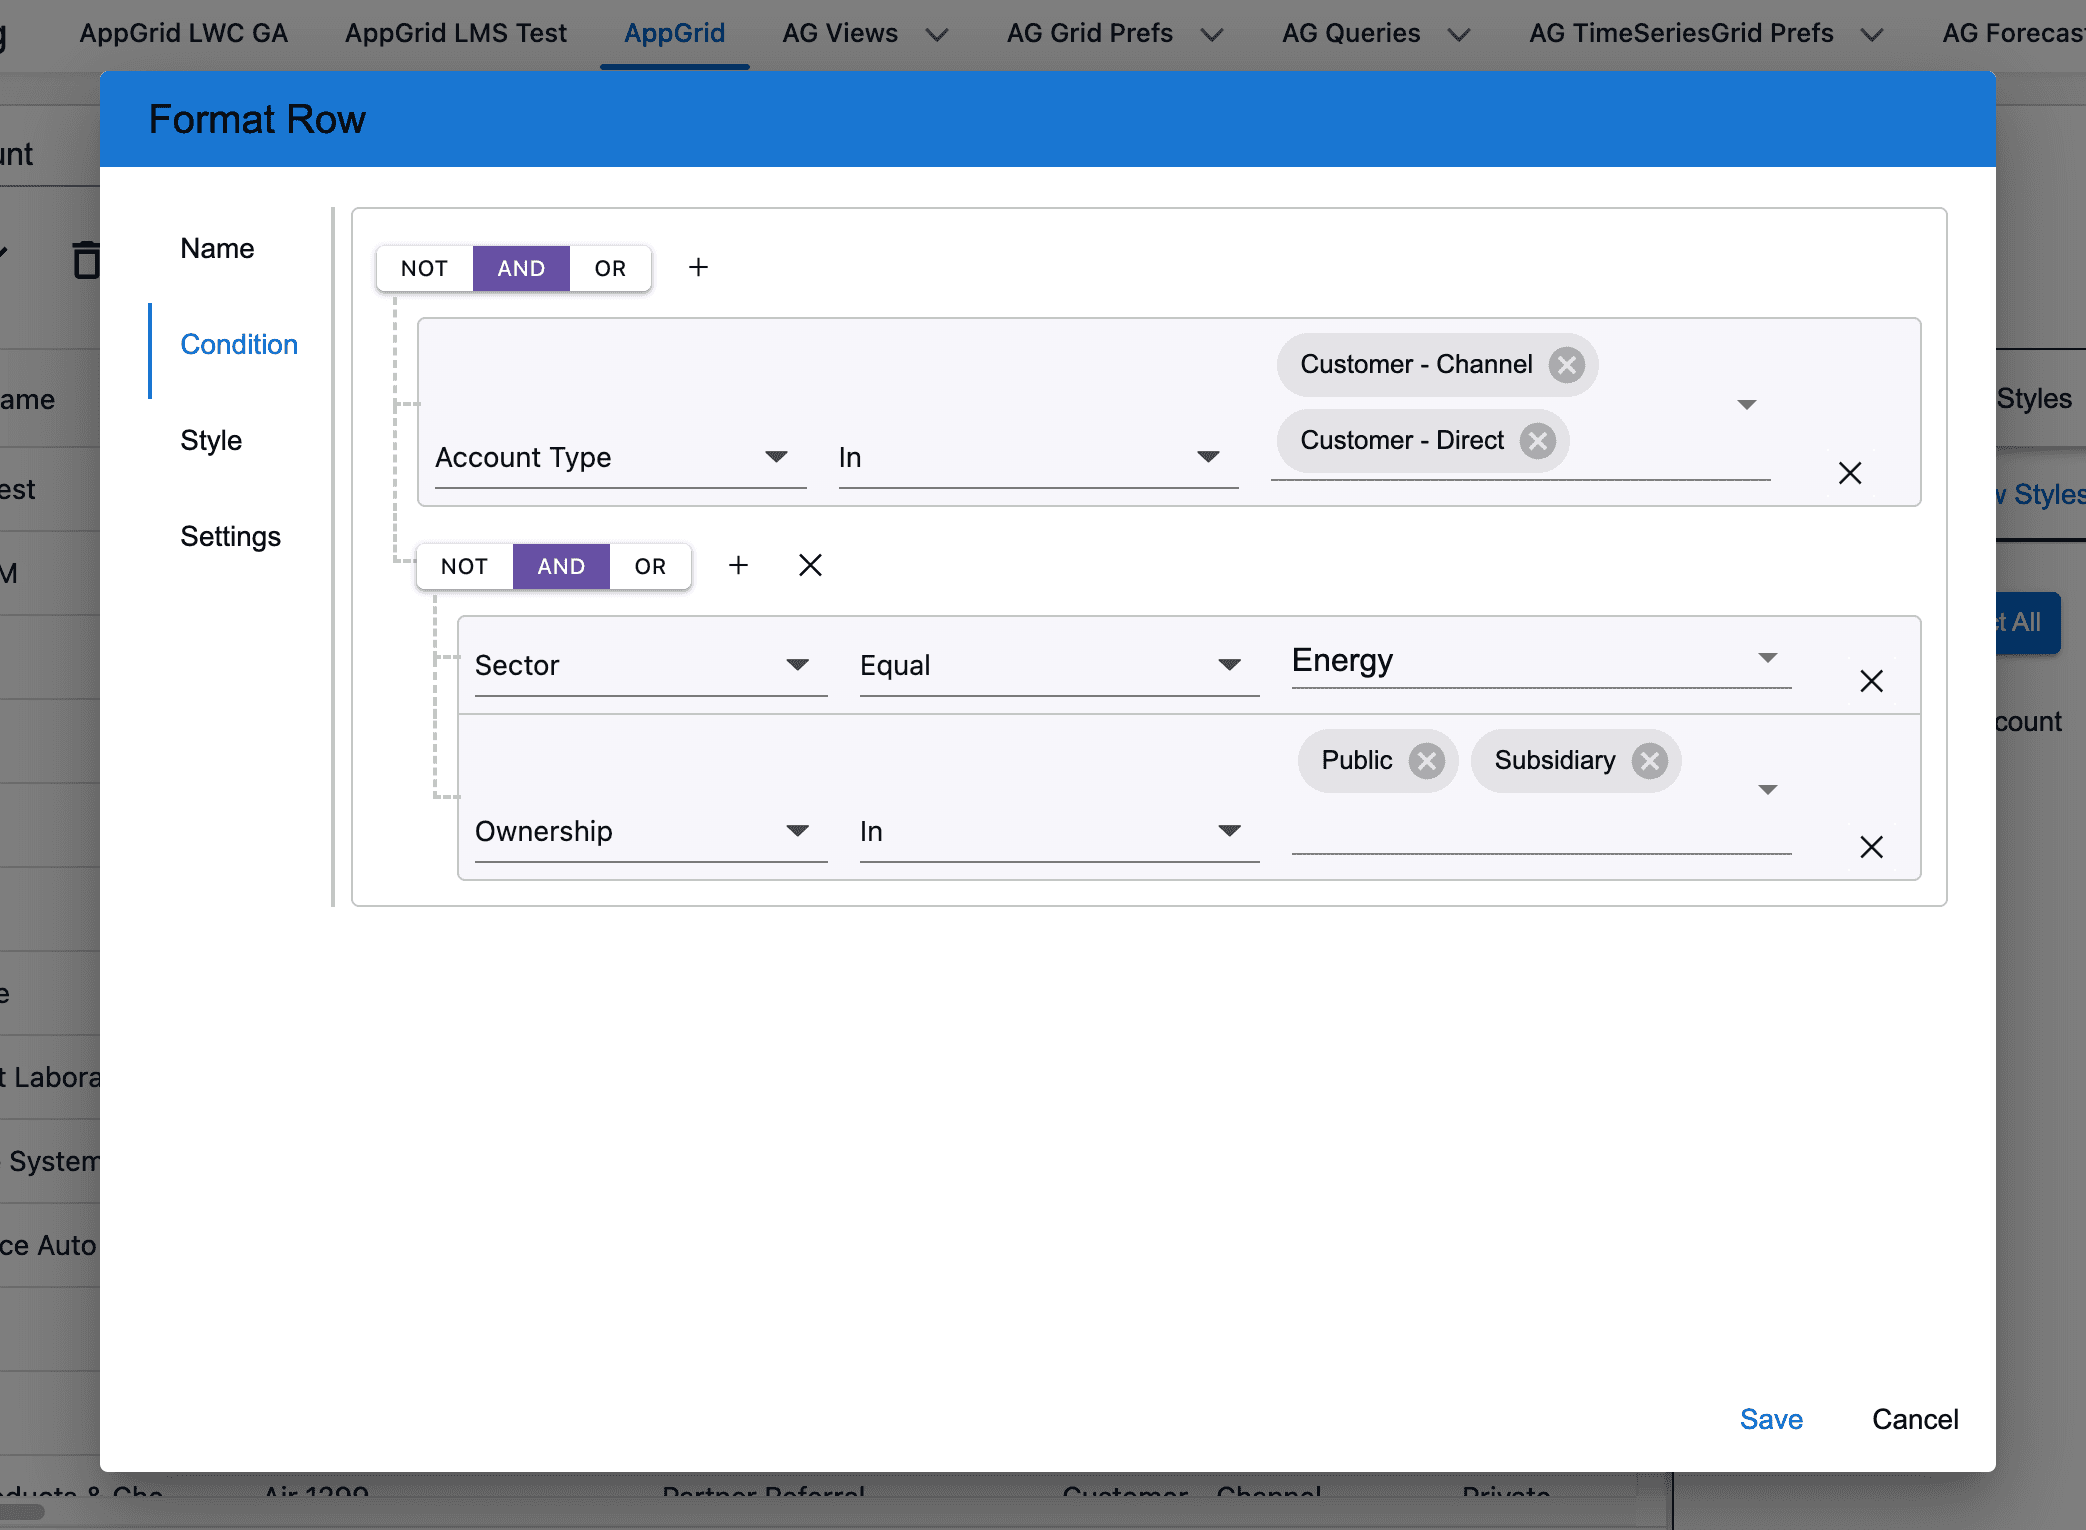
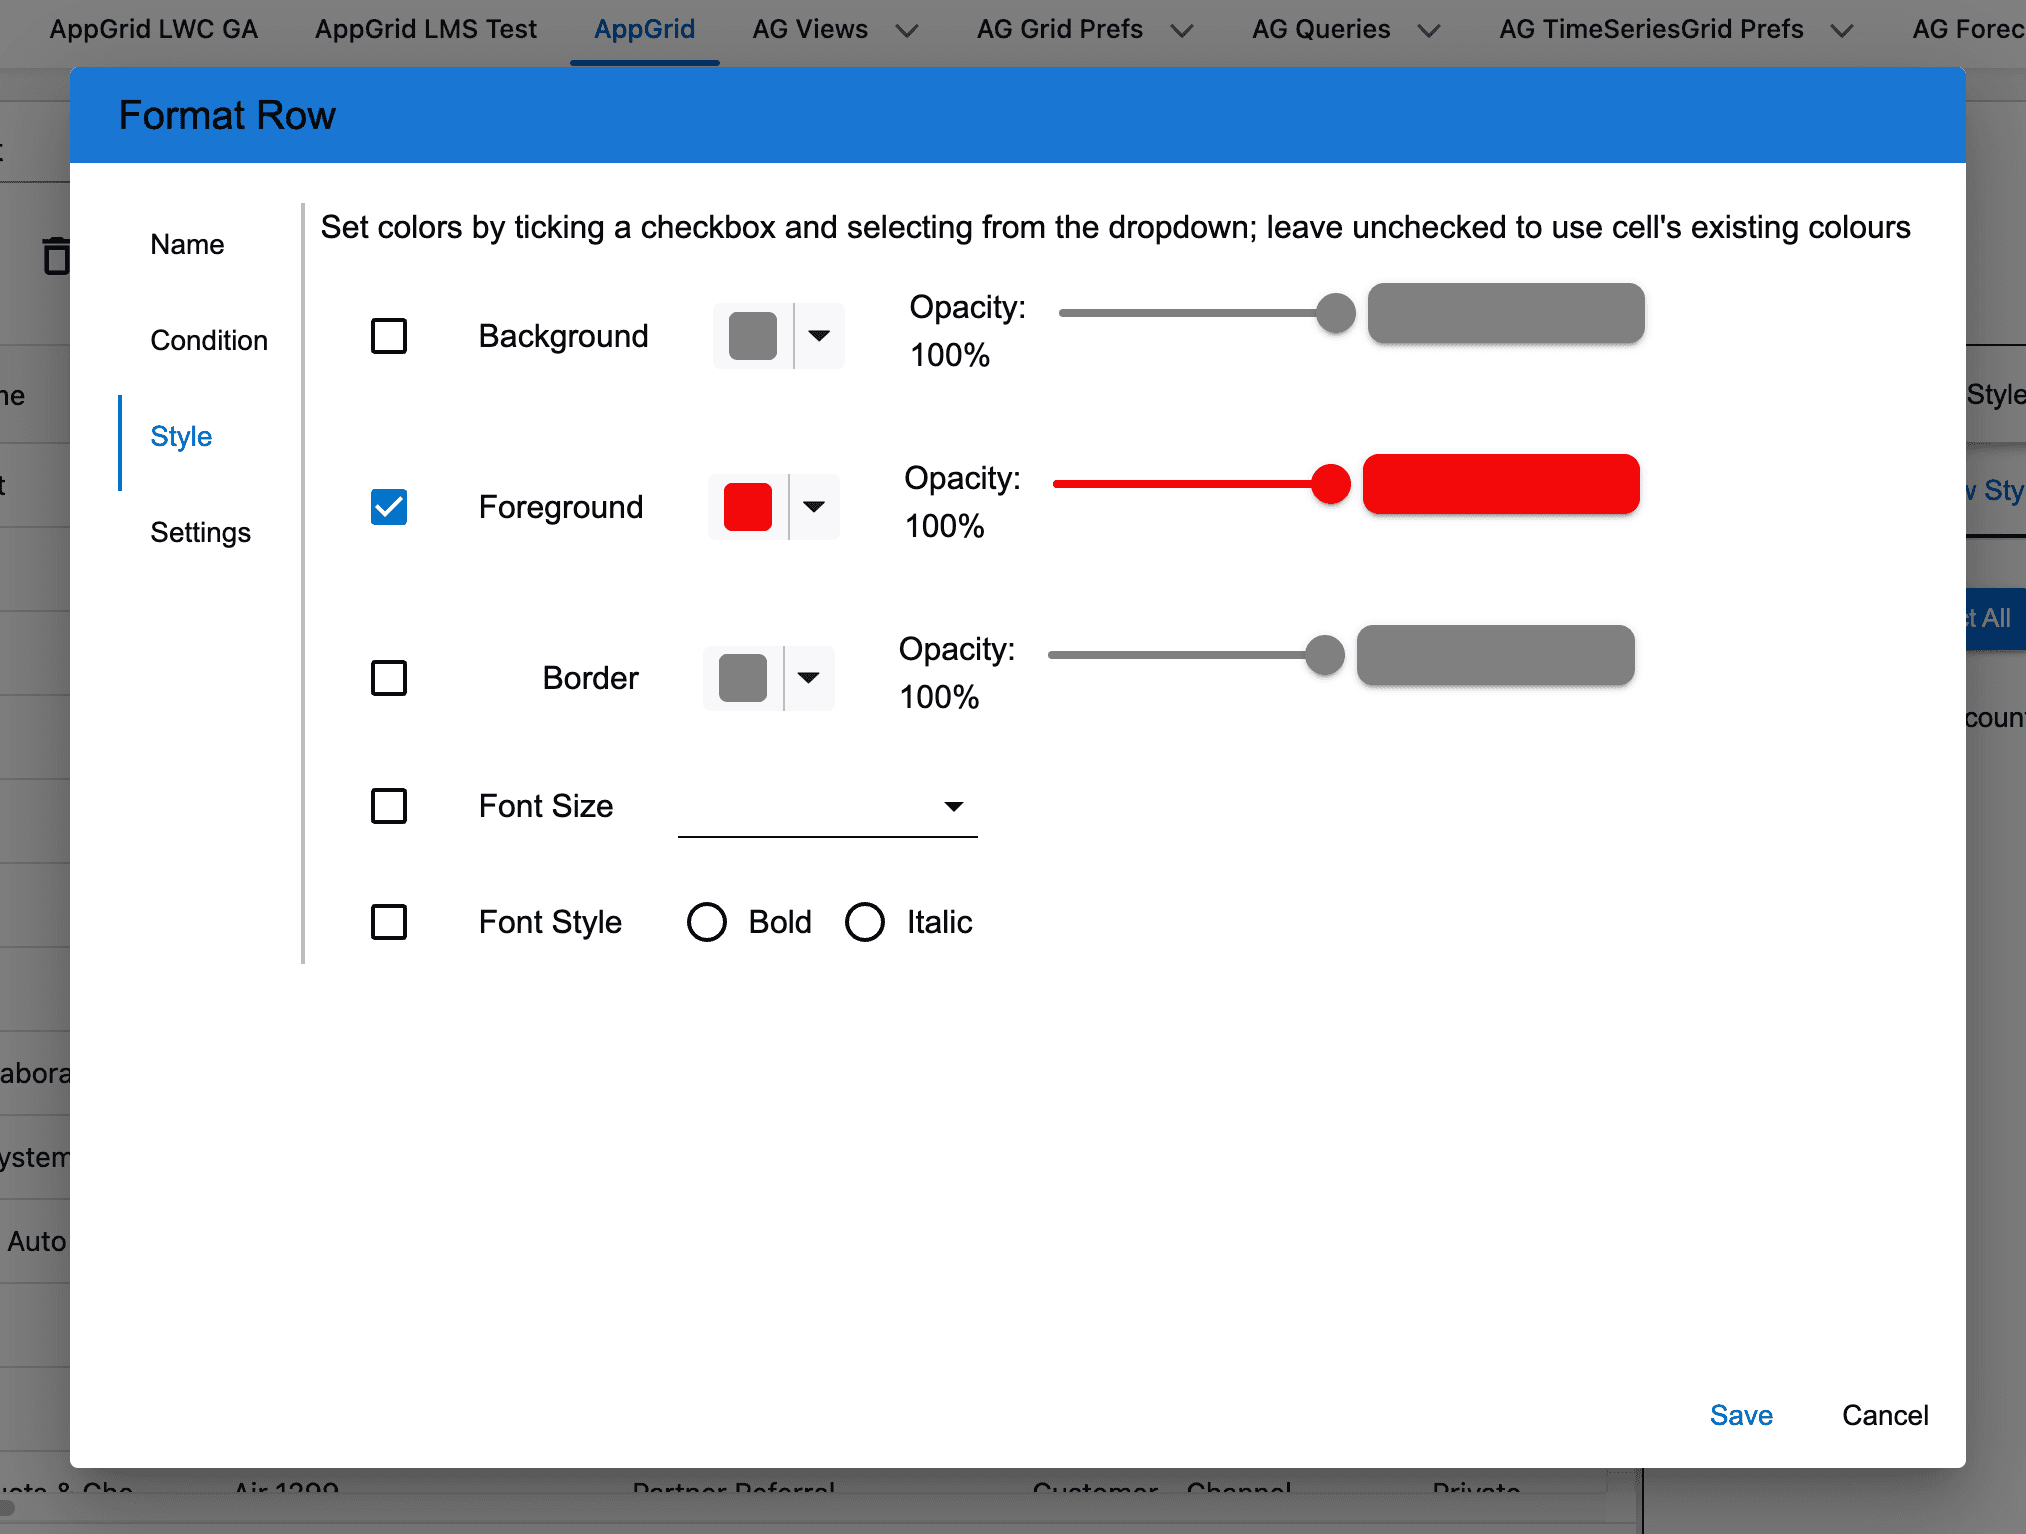
Click on the Settings tab. Define the styles that will be used to render the data.
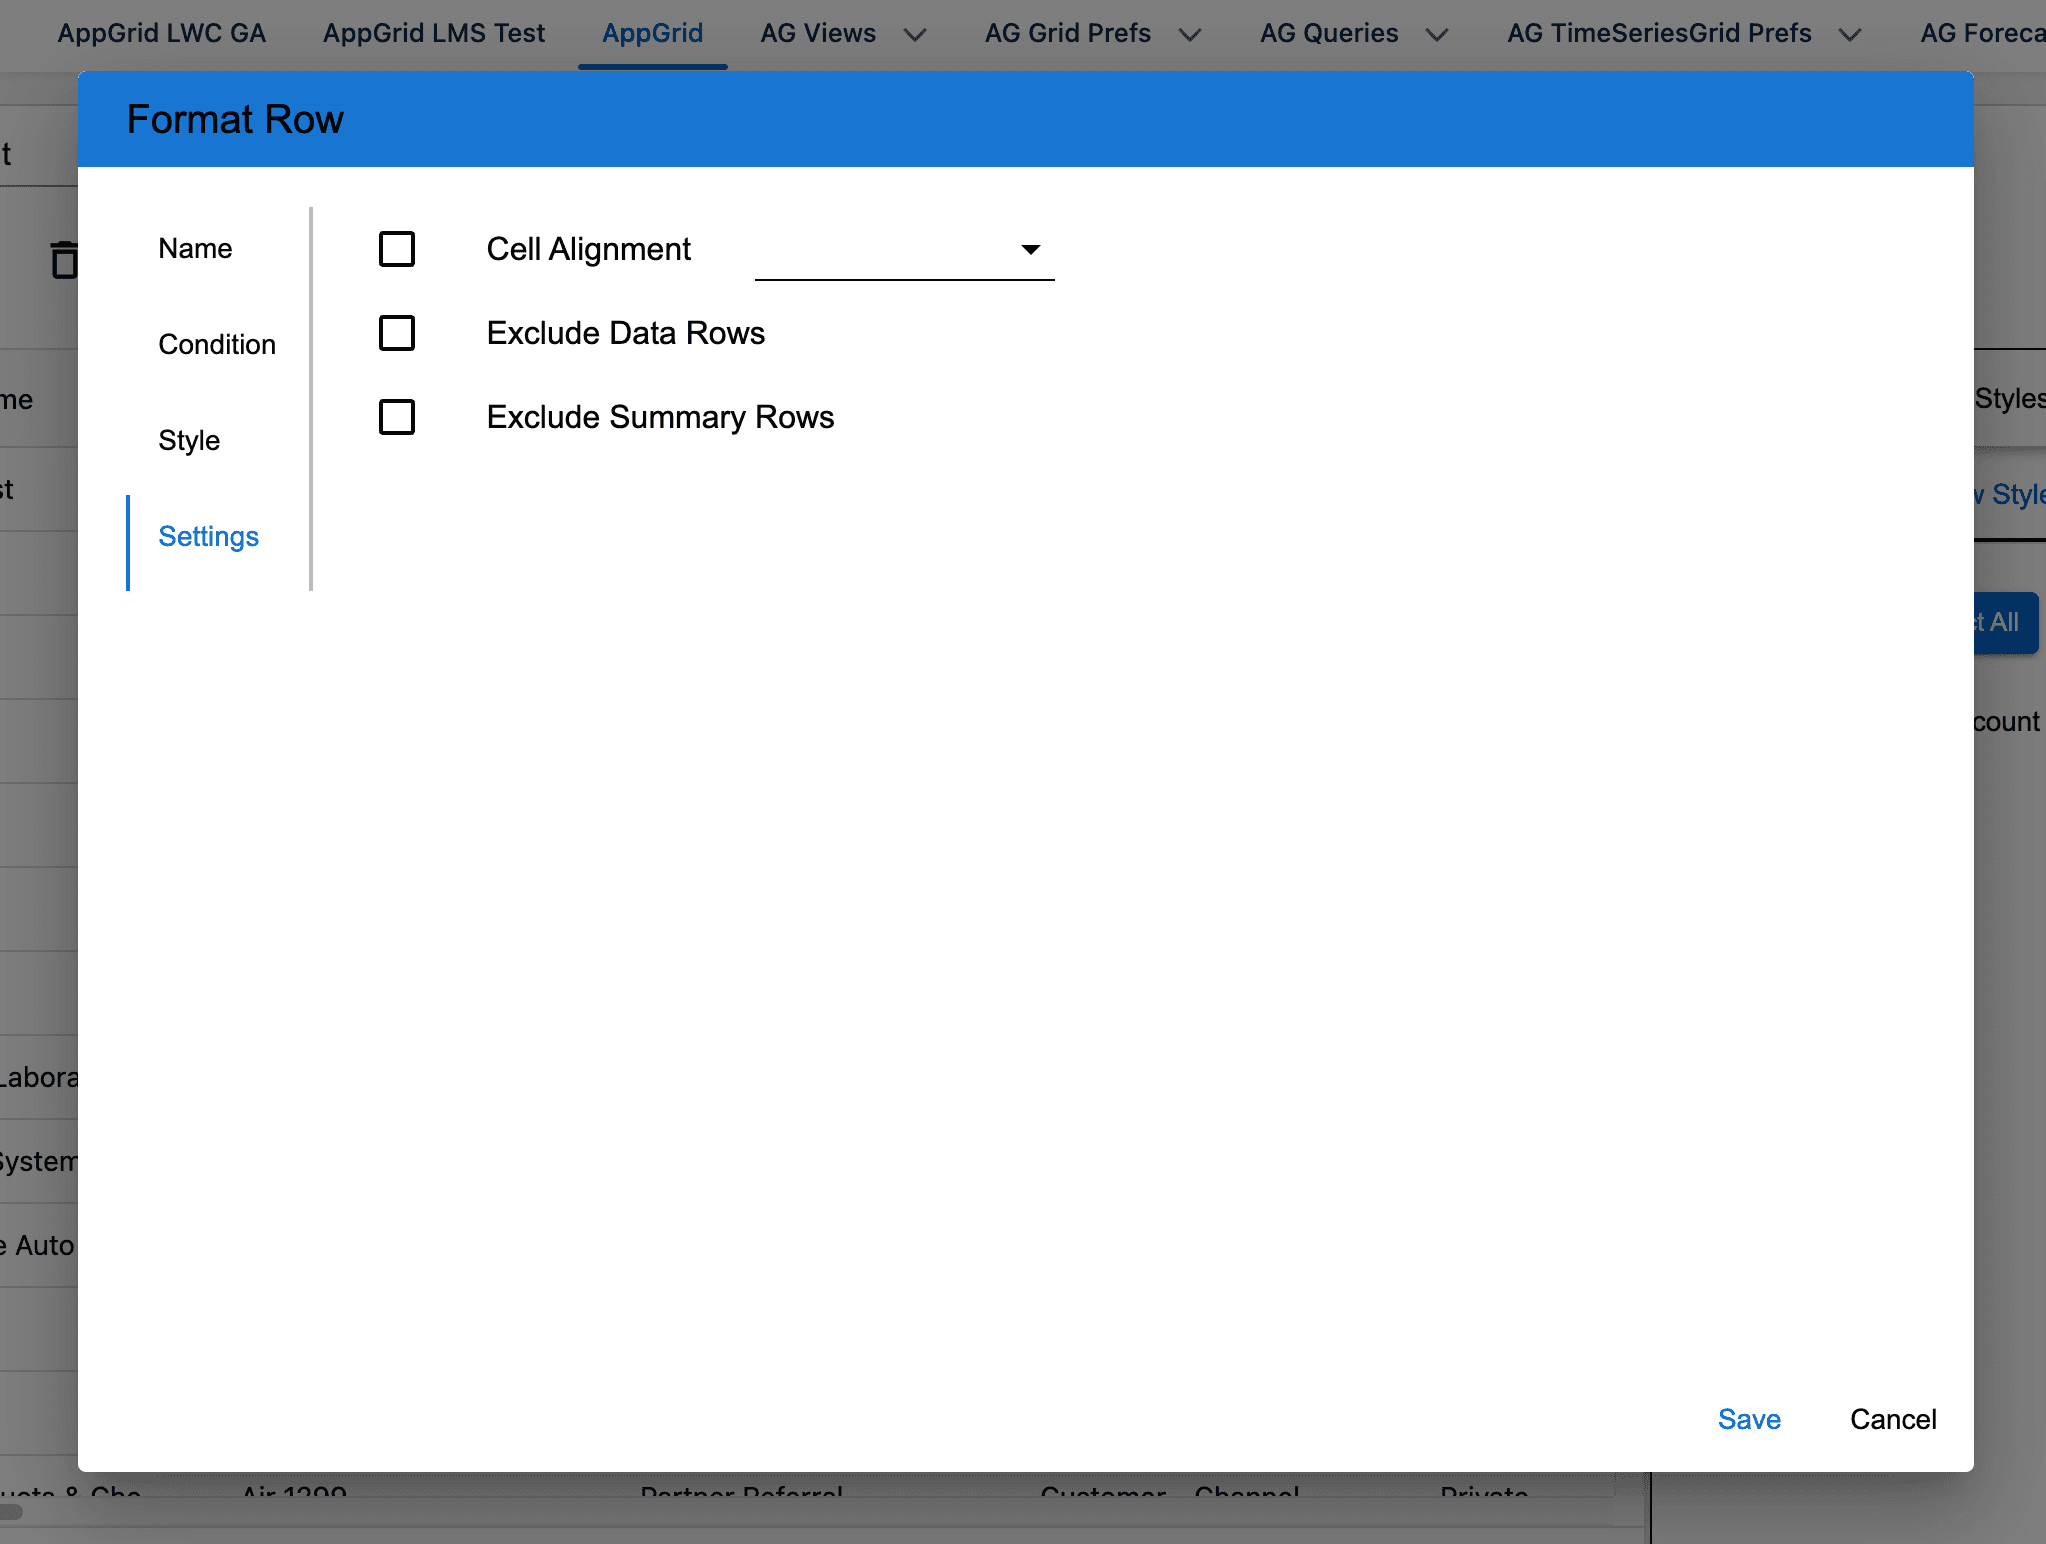
Click on the Settings tab. You can define additional style properties like cell alignment. Click the Save button to complete the style definition.
Creating calculated columns
AppGrid provides the ability to create non-bound column expressions without having the need to create Salesforce formula fields. To open the calculated column wizard, click the grid toolbar more menu and select Calculated Column wizard. The calculated column panel will be displayed.
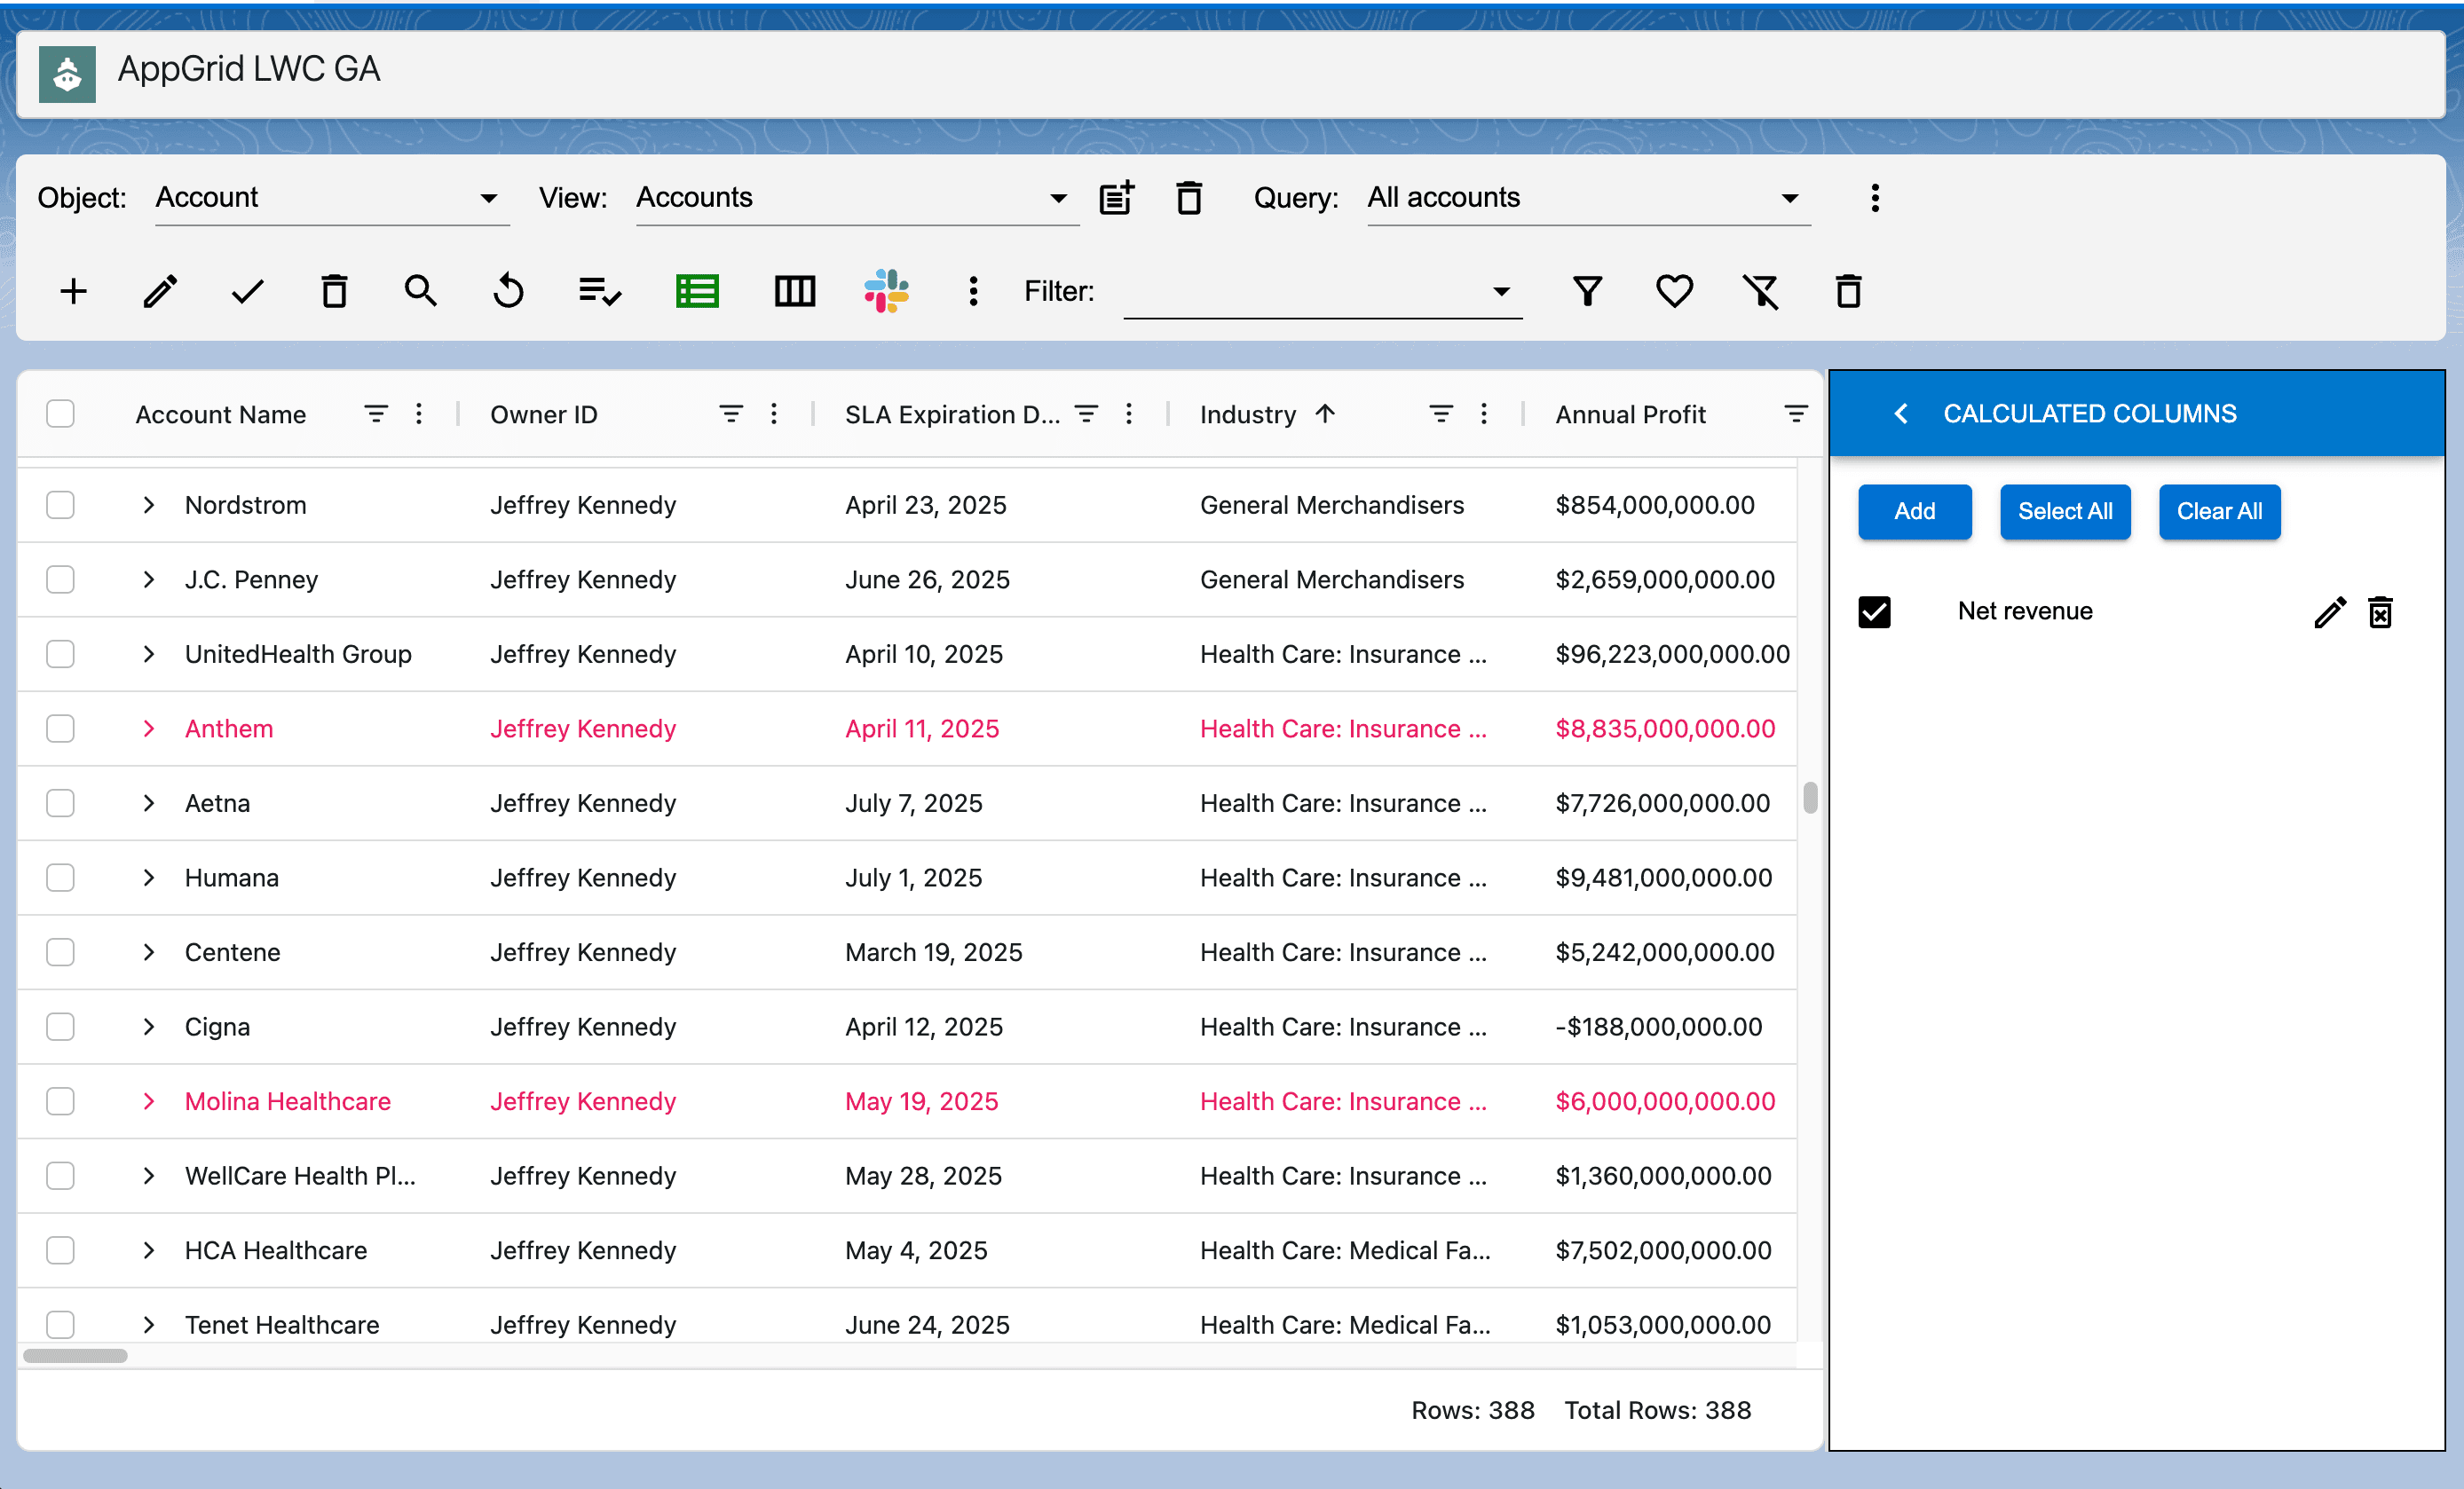
The calculated column panel provides the ability to create, edit and delete calculated columns. Toggle the visibility of your calculated columns by clicking the checkbox. Click the edit button to open the calculated columns wizard.
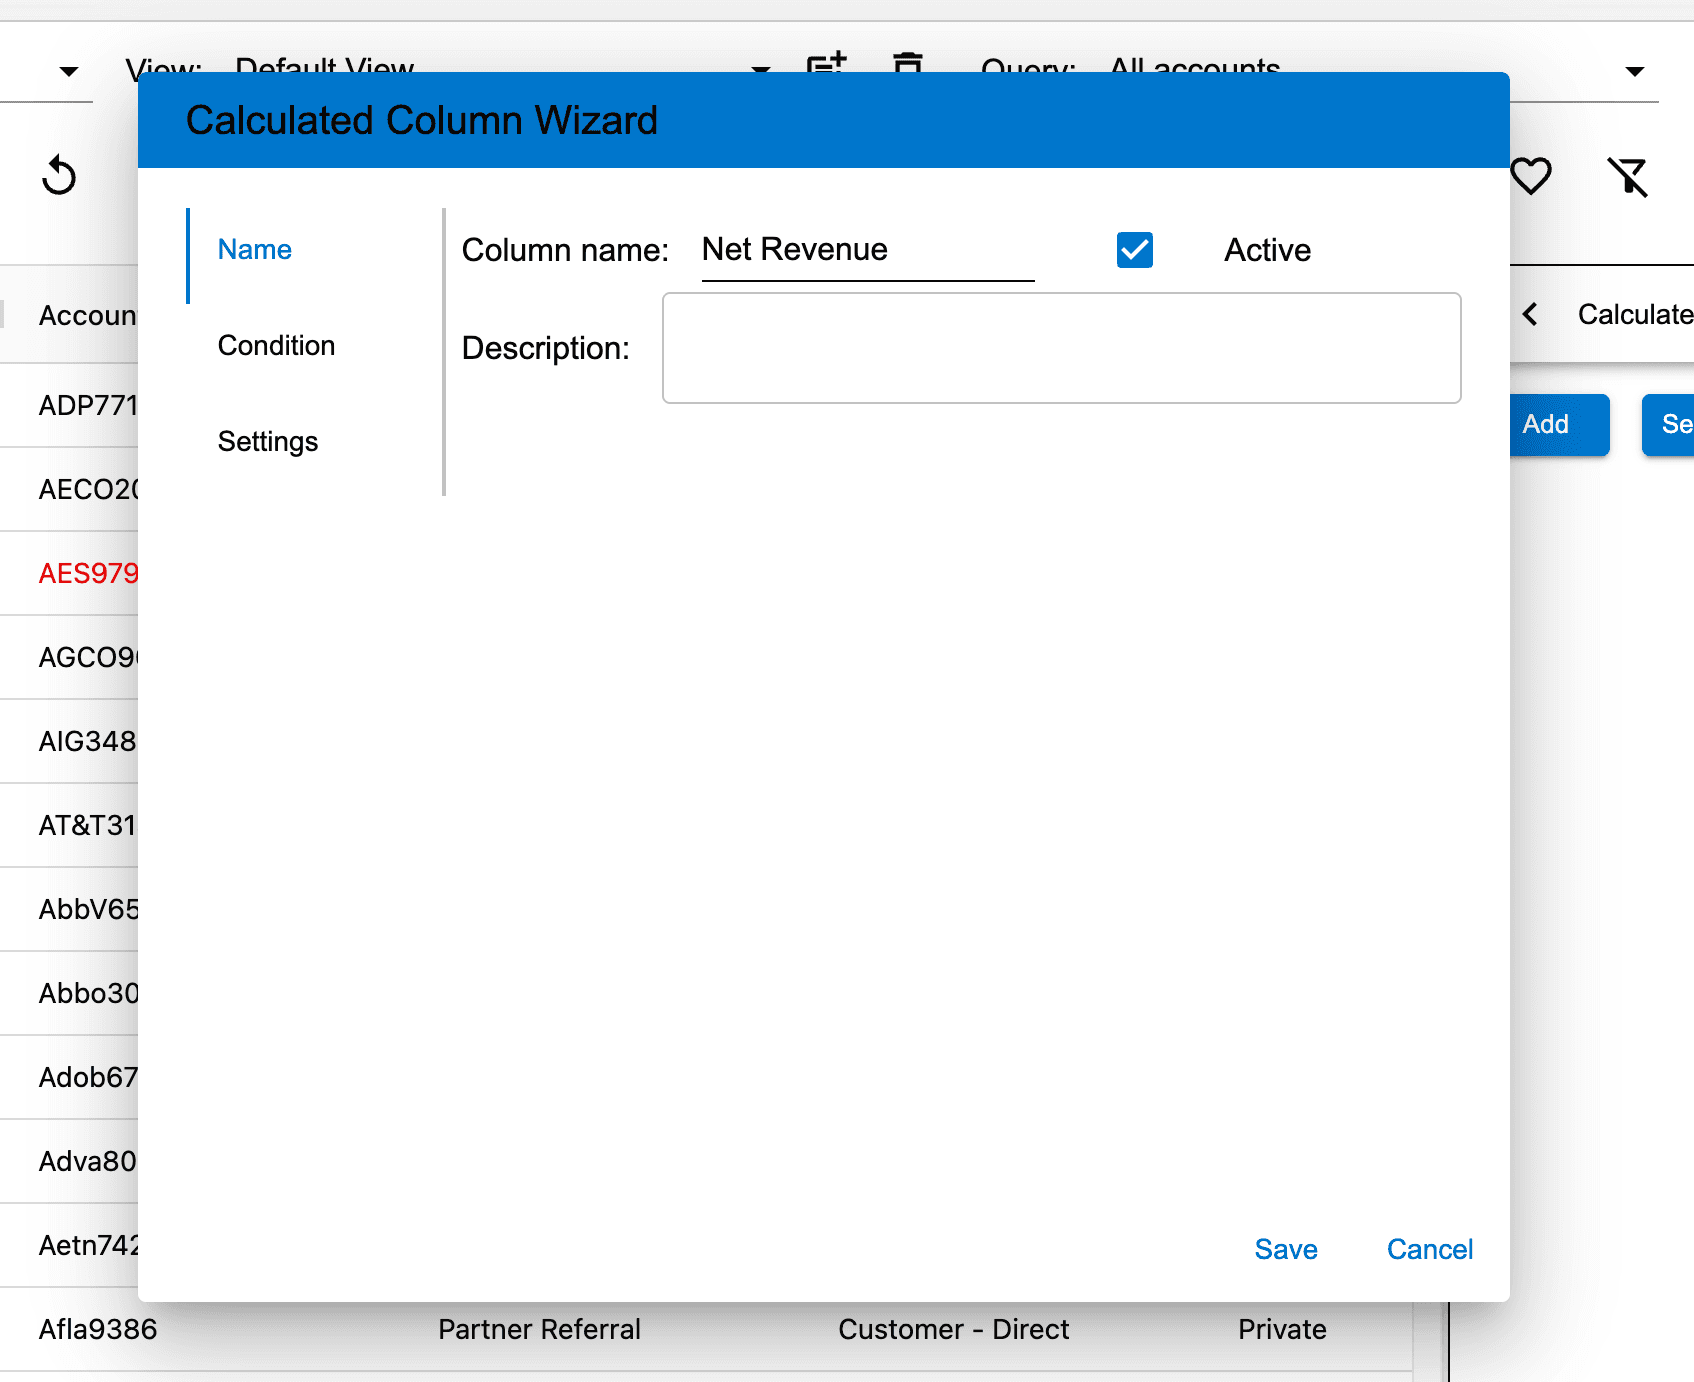
Enter a name and description for the calculated column. Click the Condition tab.
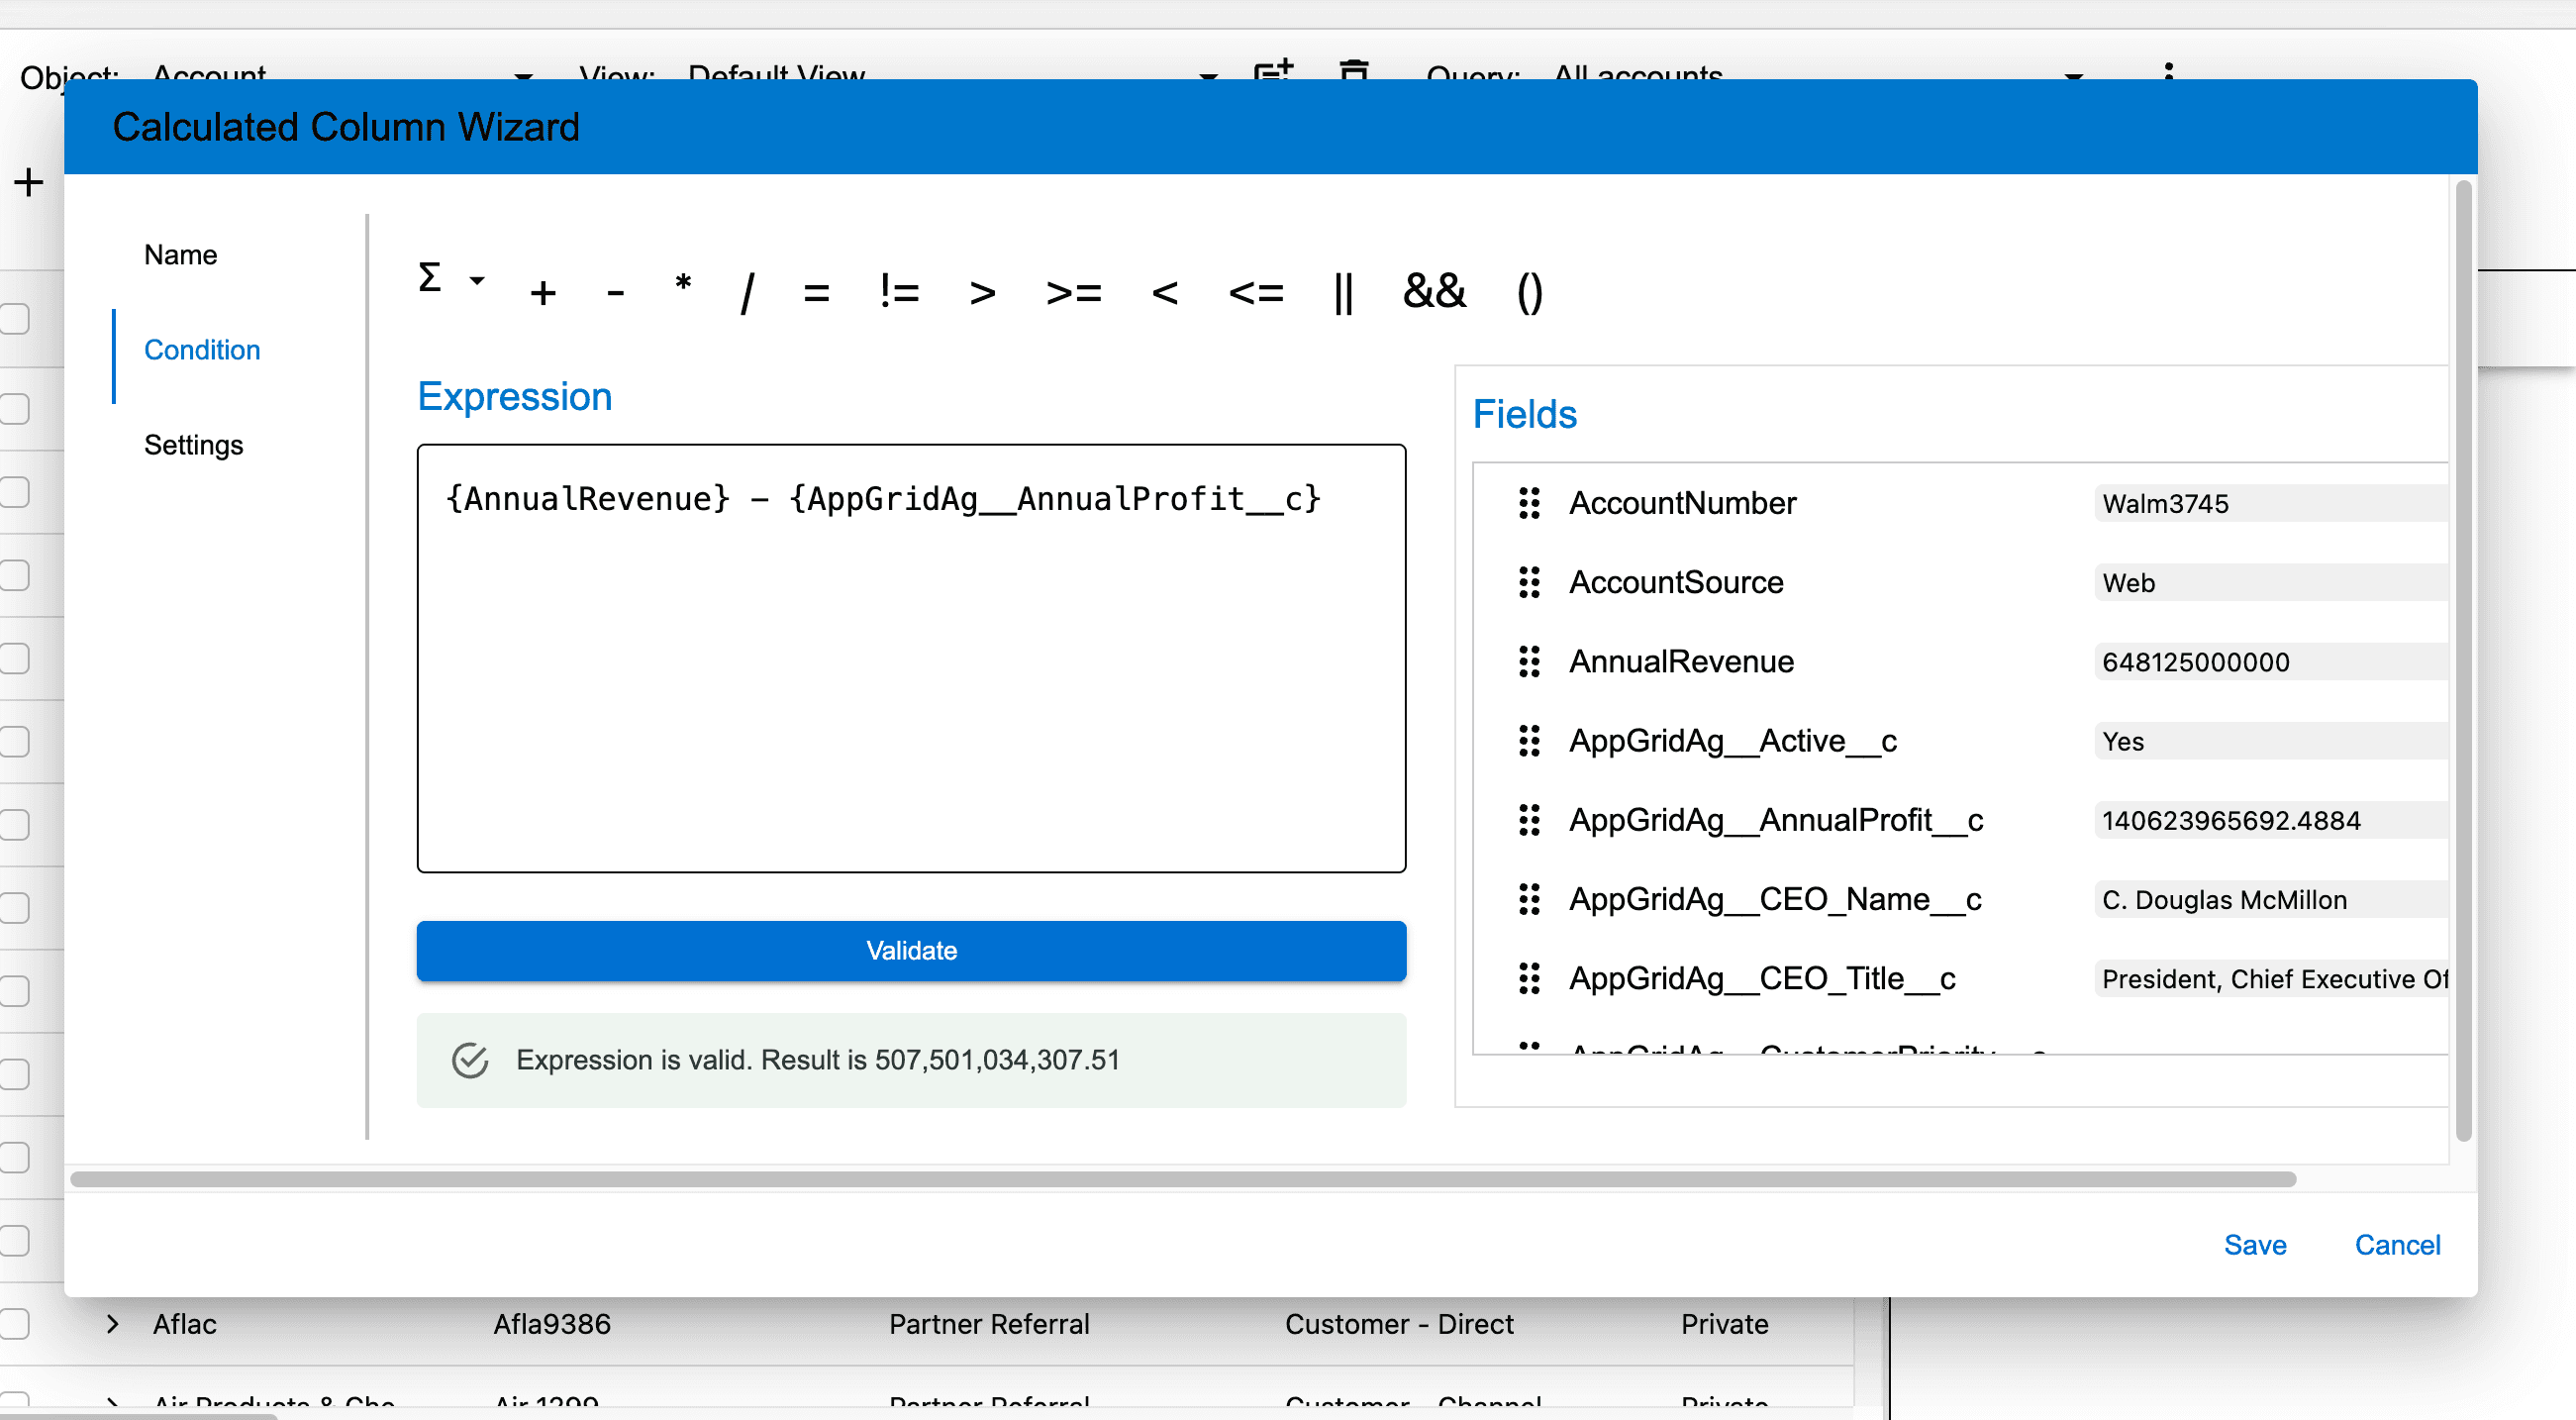
Using the Fields list, drag a field into the expression canvas and use the toolbar buttons to add your expression operators. Click the Validate button to ensure your expression does not contain any errors. Click the Settings tab.
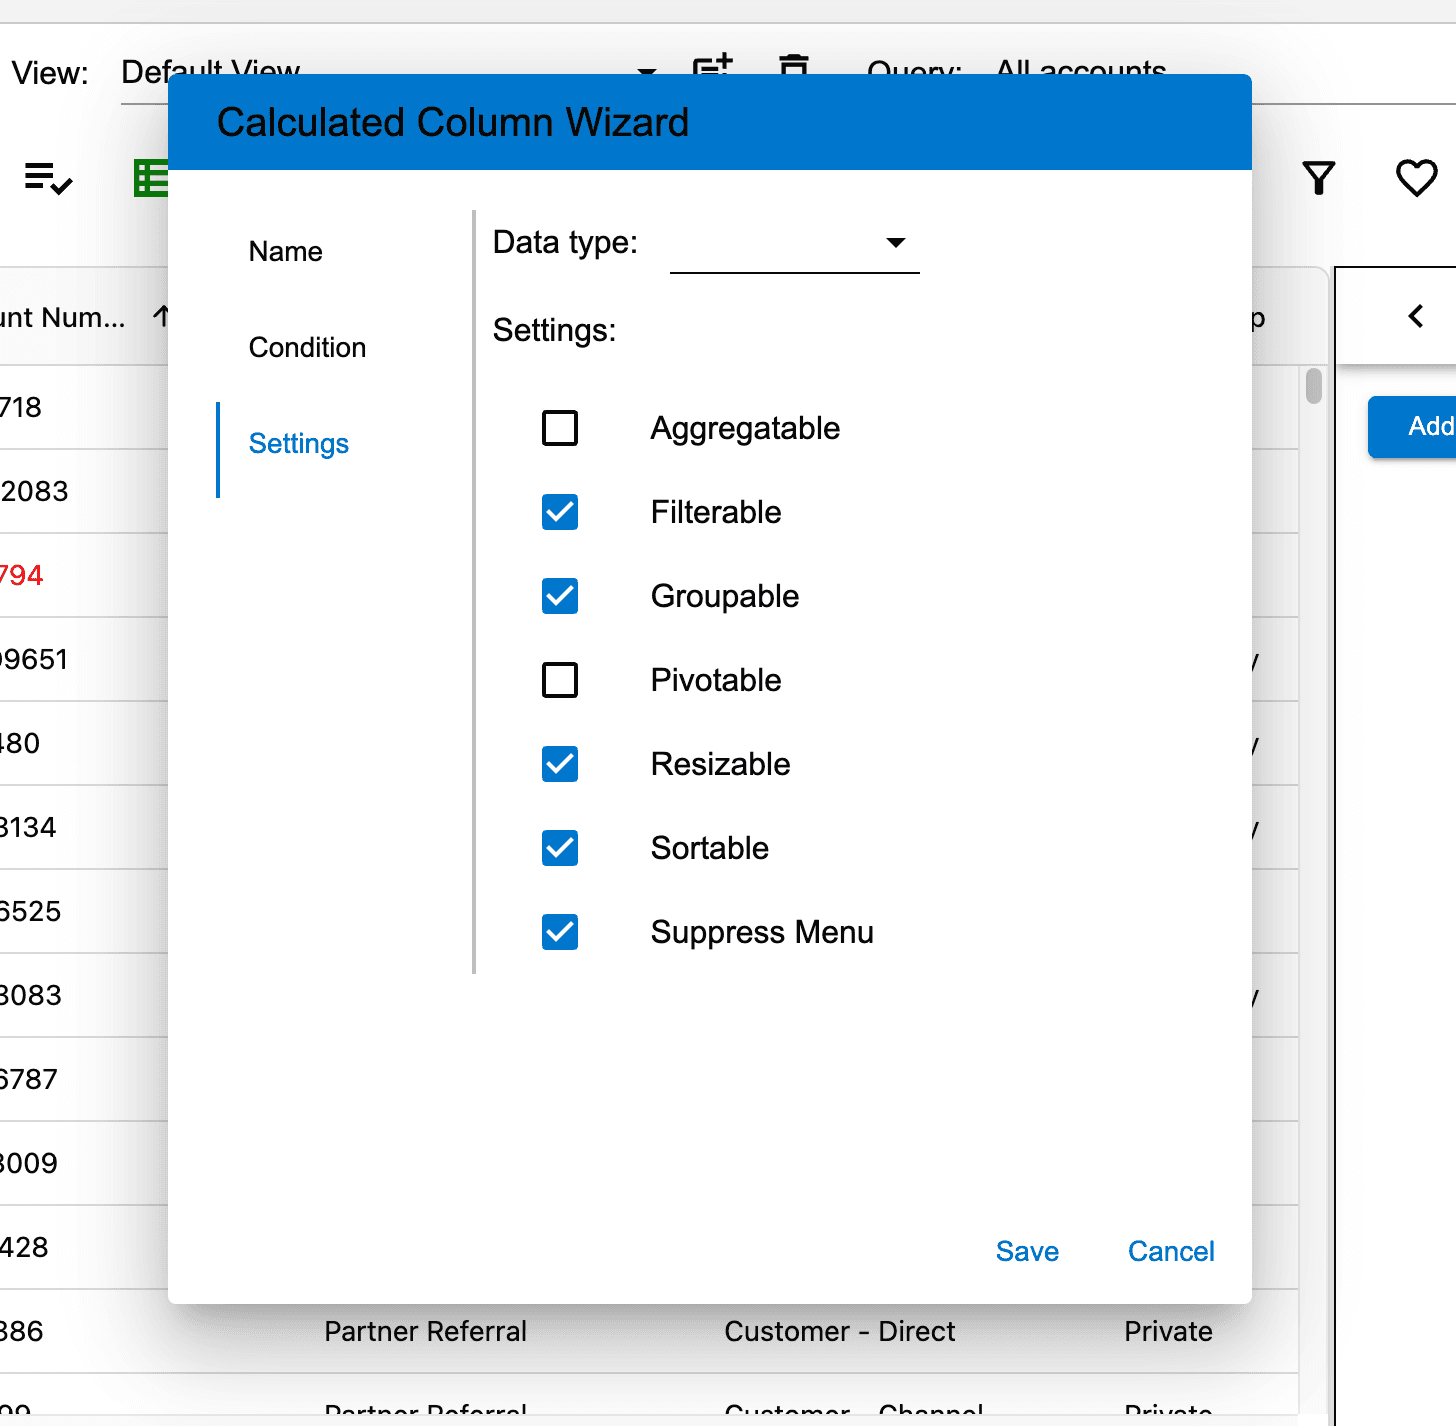
The Settings tab allows you to define additional properties for the calculated column. Click the Save button.
Creating and using flows
The AppGrid Flow Integration feature brings the full power of Salesforce Autolaunched Flows directly into AppGrid, letting admins embed point-and-click automation into any grid without writing code. Users can connect any active Autolaunched Flow to a grid, configure its input parameters with sensible defaults, and execute the flow against one or many selected rows in a single click.
AppGrid auto-discovers the flow's input variables, intelligently maps row-ID collection inputs, and surfaces the flow's results back to the user as an in-grid notification — so a flow that enriches data, updates records, sends notifications, kicks off approvals, or rolls up totals feels like a native AppGrid action.
Because each configuration is stored per user as an AG_Flow__c record and runs under Salesforce user-mode security, admins get governed, auditable batch automation that respects field-level permissions and the user's own flow access.
To use the feature, open a grid and click the Flow Wizard button on the left navigation rail. In the panel, search for an Autolaunched Flow by name — AppGrid inspects the flow's active version and automatically lists its input variables.
Fill in default values for any String, Integer, Decimal, or Boolean parameters you want pre-populated (unsupported types like Date or SObject are shown but disabled), then choose which input variable should receive the selected row IDs; AppGrid will auto-suggest a List<Id> or List<SObject> input, or the conventional flowRecordIds variable if it exists. Save the configuration and it stays attached to that object's grid.
To run it, simply select one or more rows in the grid, reopen the Flow Wizard, and click Execute — the flow runs against your selection with the configured properties, and the result (a count, message, or value returned by the flow) appears as a success snackbar.
Configuring permissions
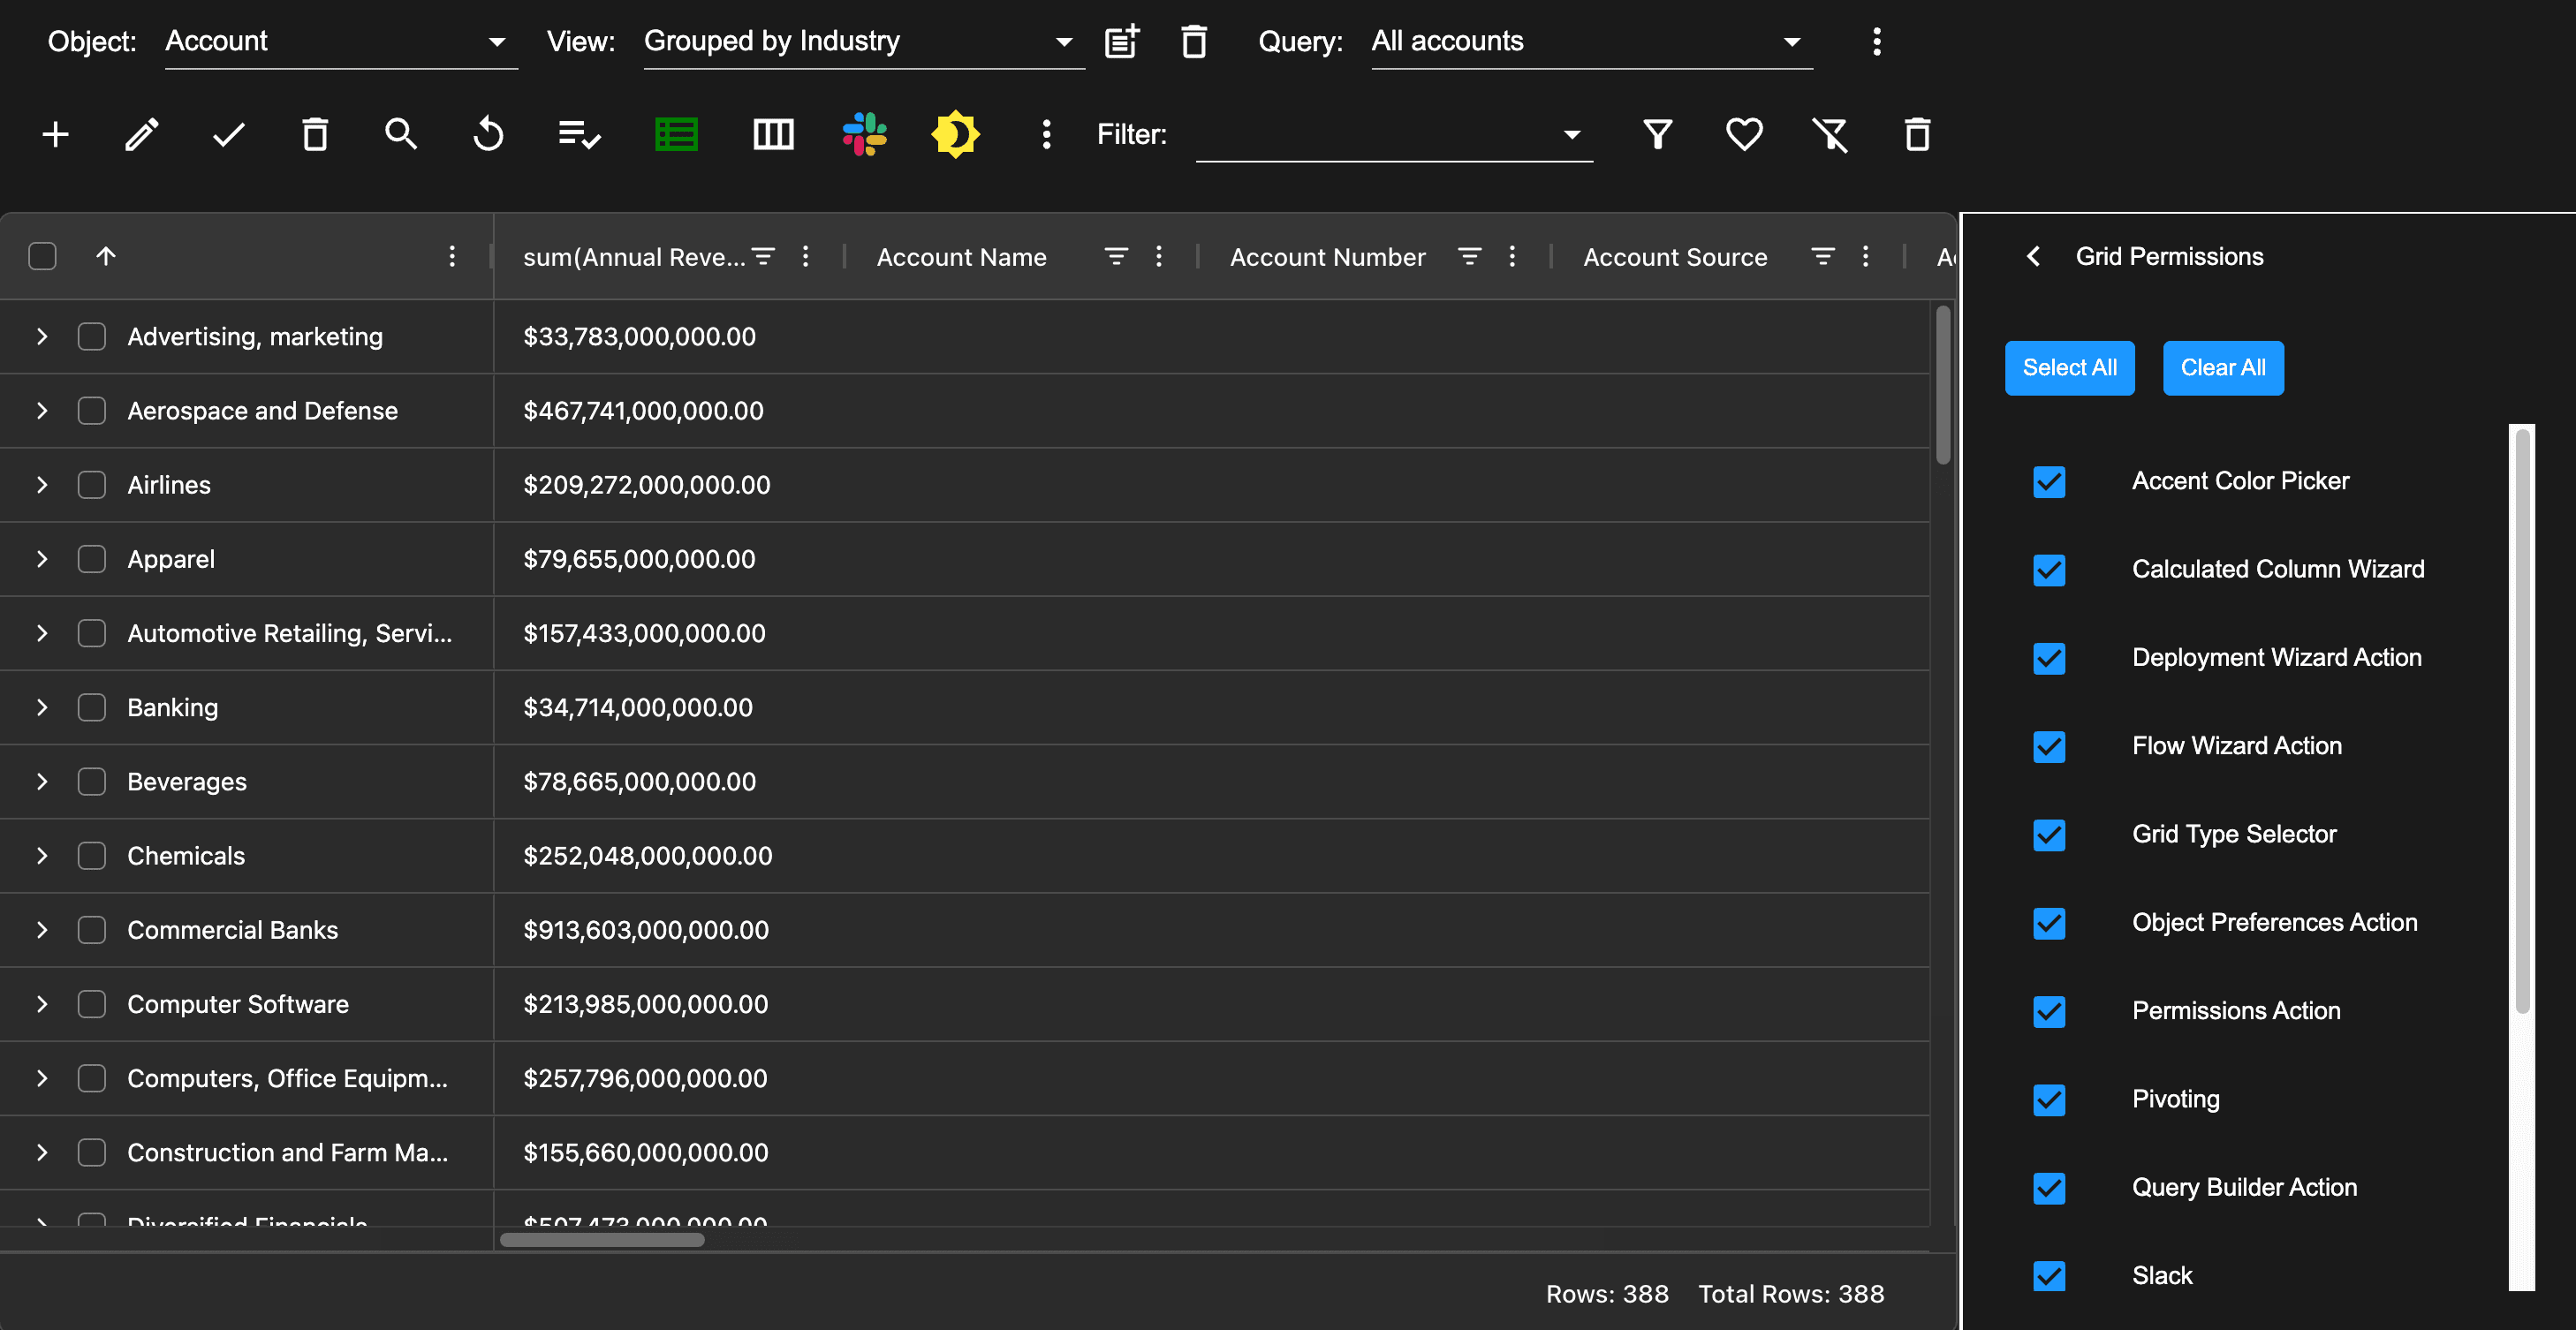
AppGrid provides the ability to specify what features are enabled for a given user. This is managed by the permissions settings assigned to each user and configured by the permissions wizard. Access to the permissions wizard is usually assigned to system administrators.
Watch the video for an overview of what permissions are available to be configured.
Selecting rows
Click the checkbox on a row to select it. You can select more than 1 row for certain operations like delete. You can use the toolbar button to select all rows or clear all rows.
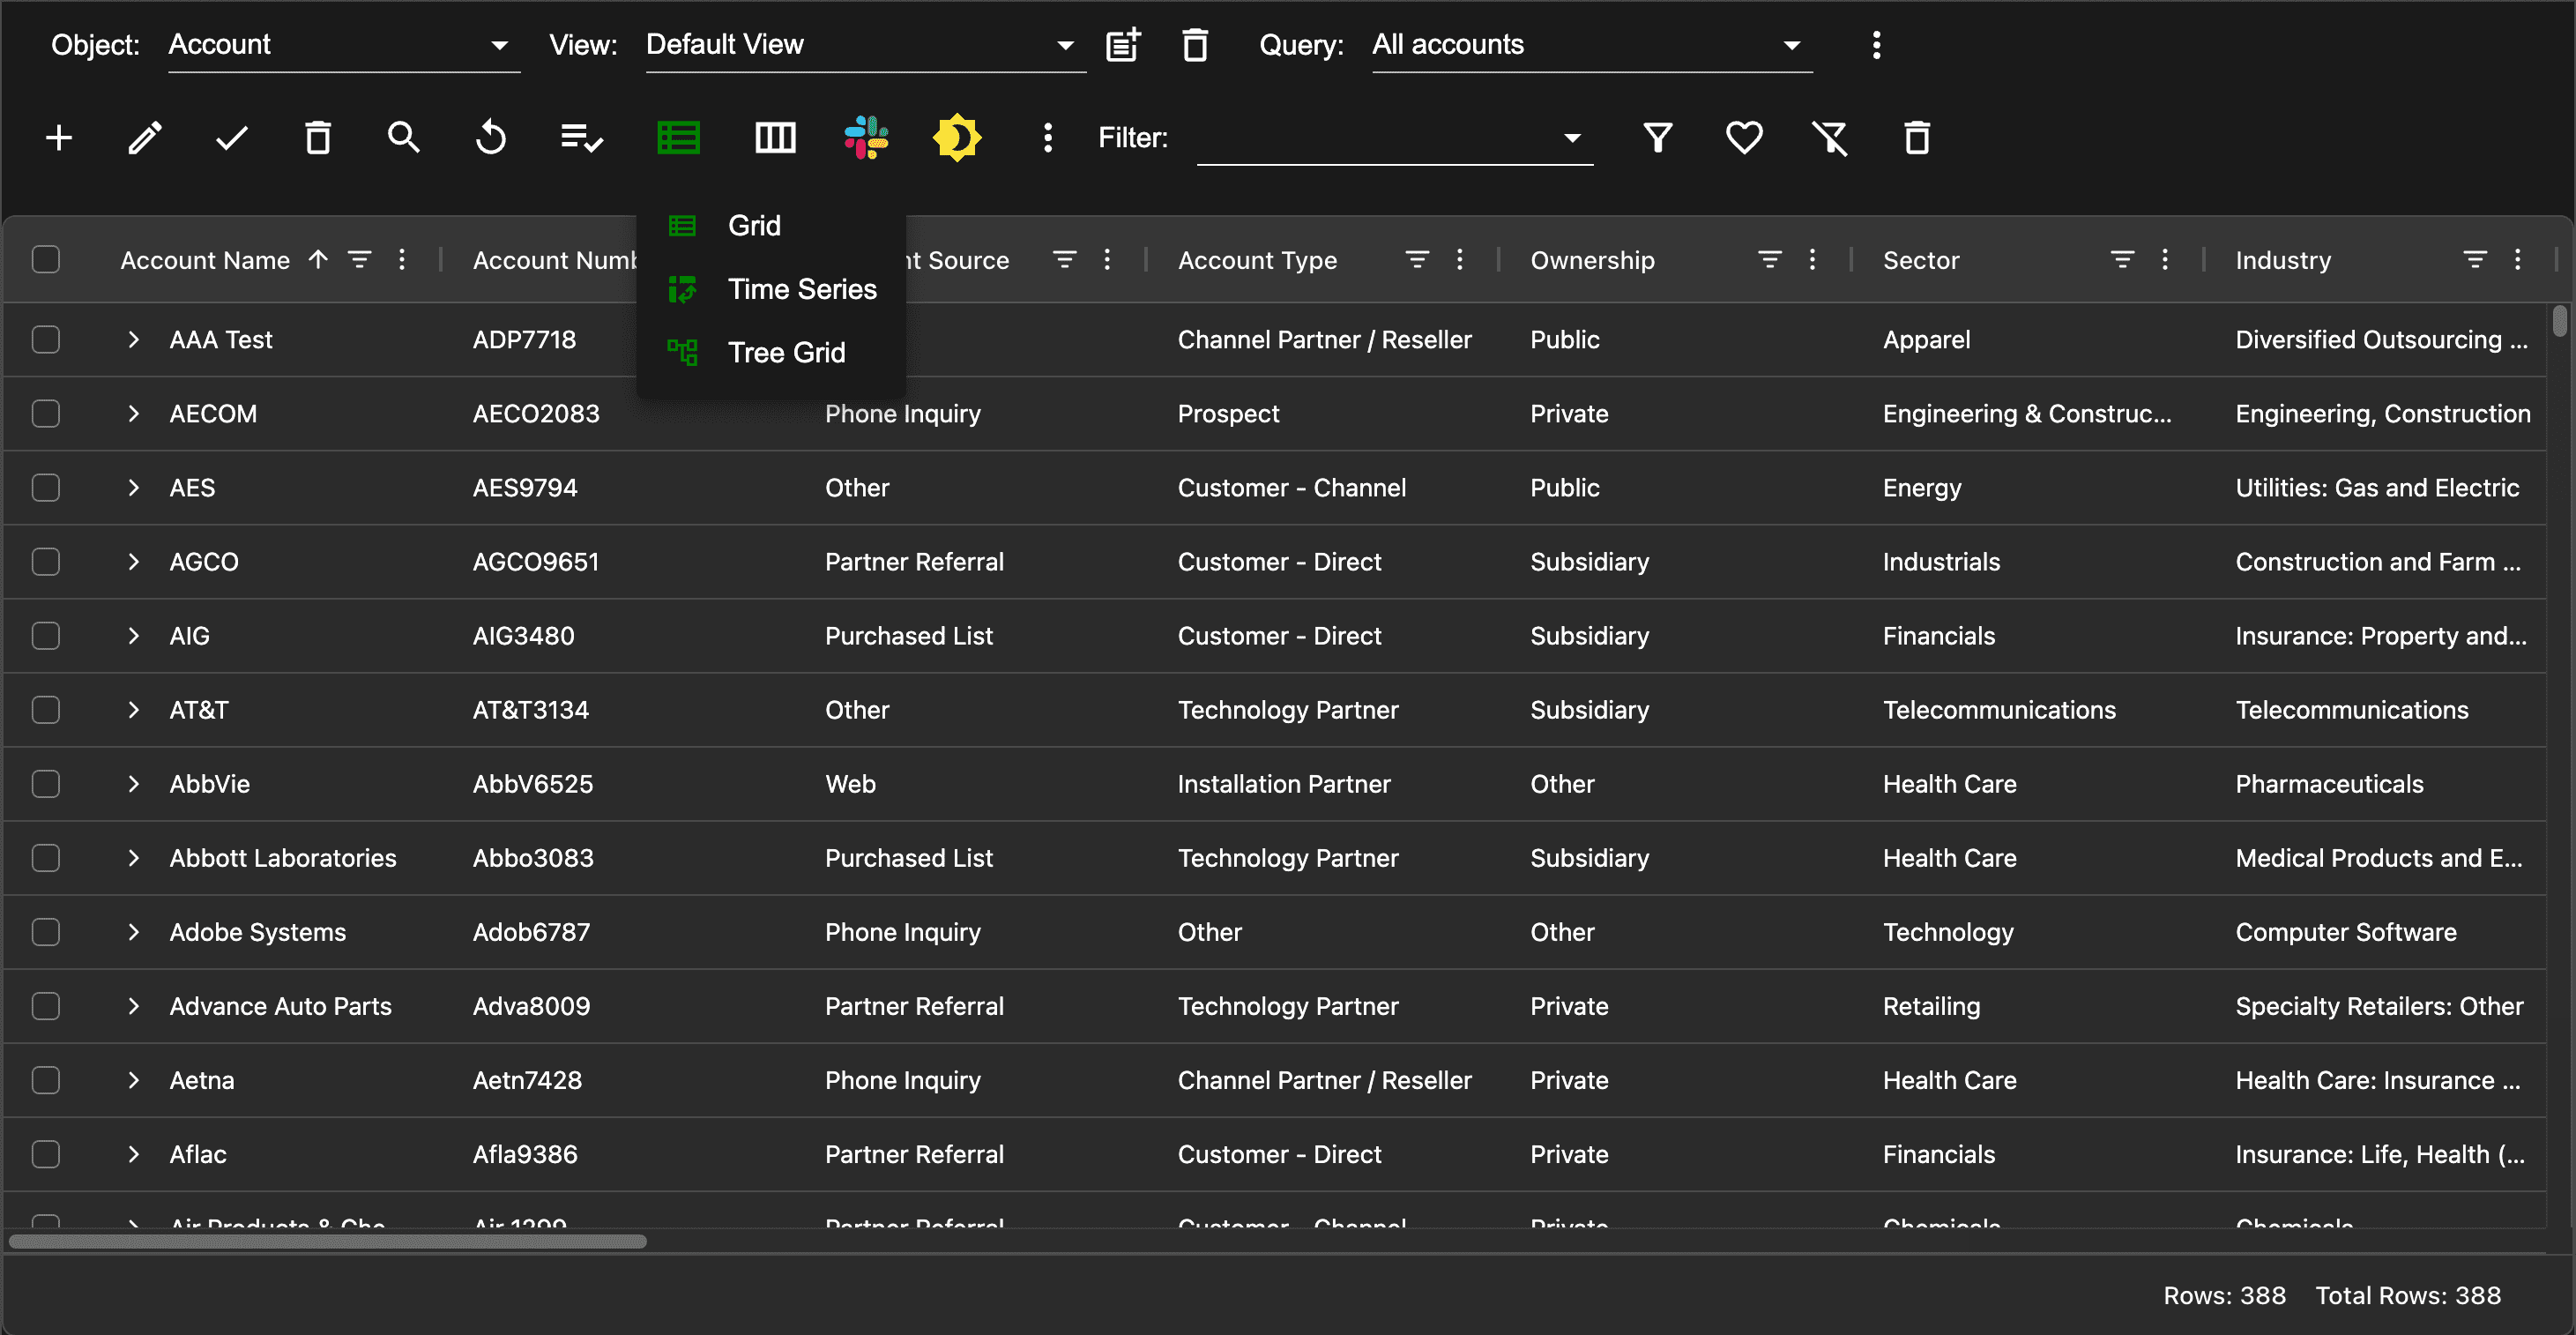
Selecting grid types
AppGrid provides 5 different types of views: grid view, grouped view, pivot view, tree grid view and timeSeries view. Note: the treeGrid menu item will not be available if the selected object does not have a self-referencing field. Each of these views are designed to optimize a given type of workflow. To select a grid type, click the GridType selector in the grid toolbar. Watch the video for an overview of using the different types of grids.
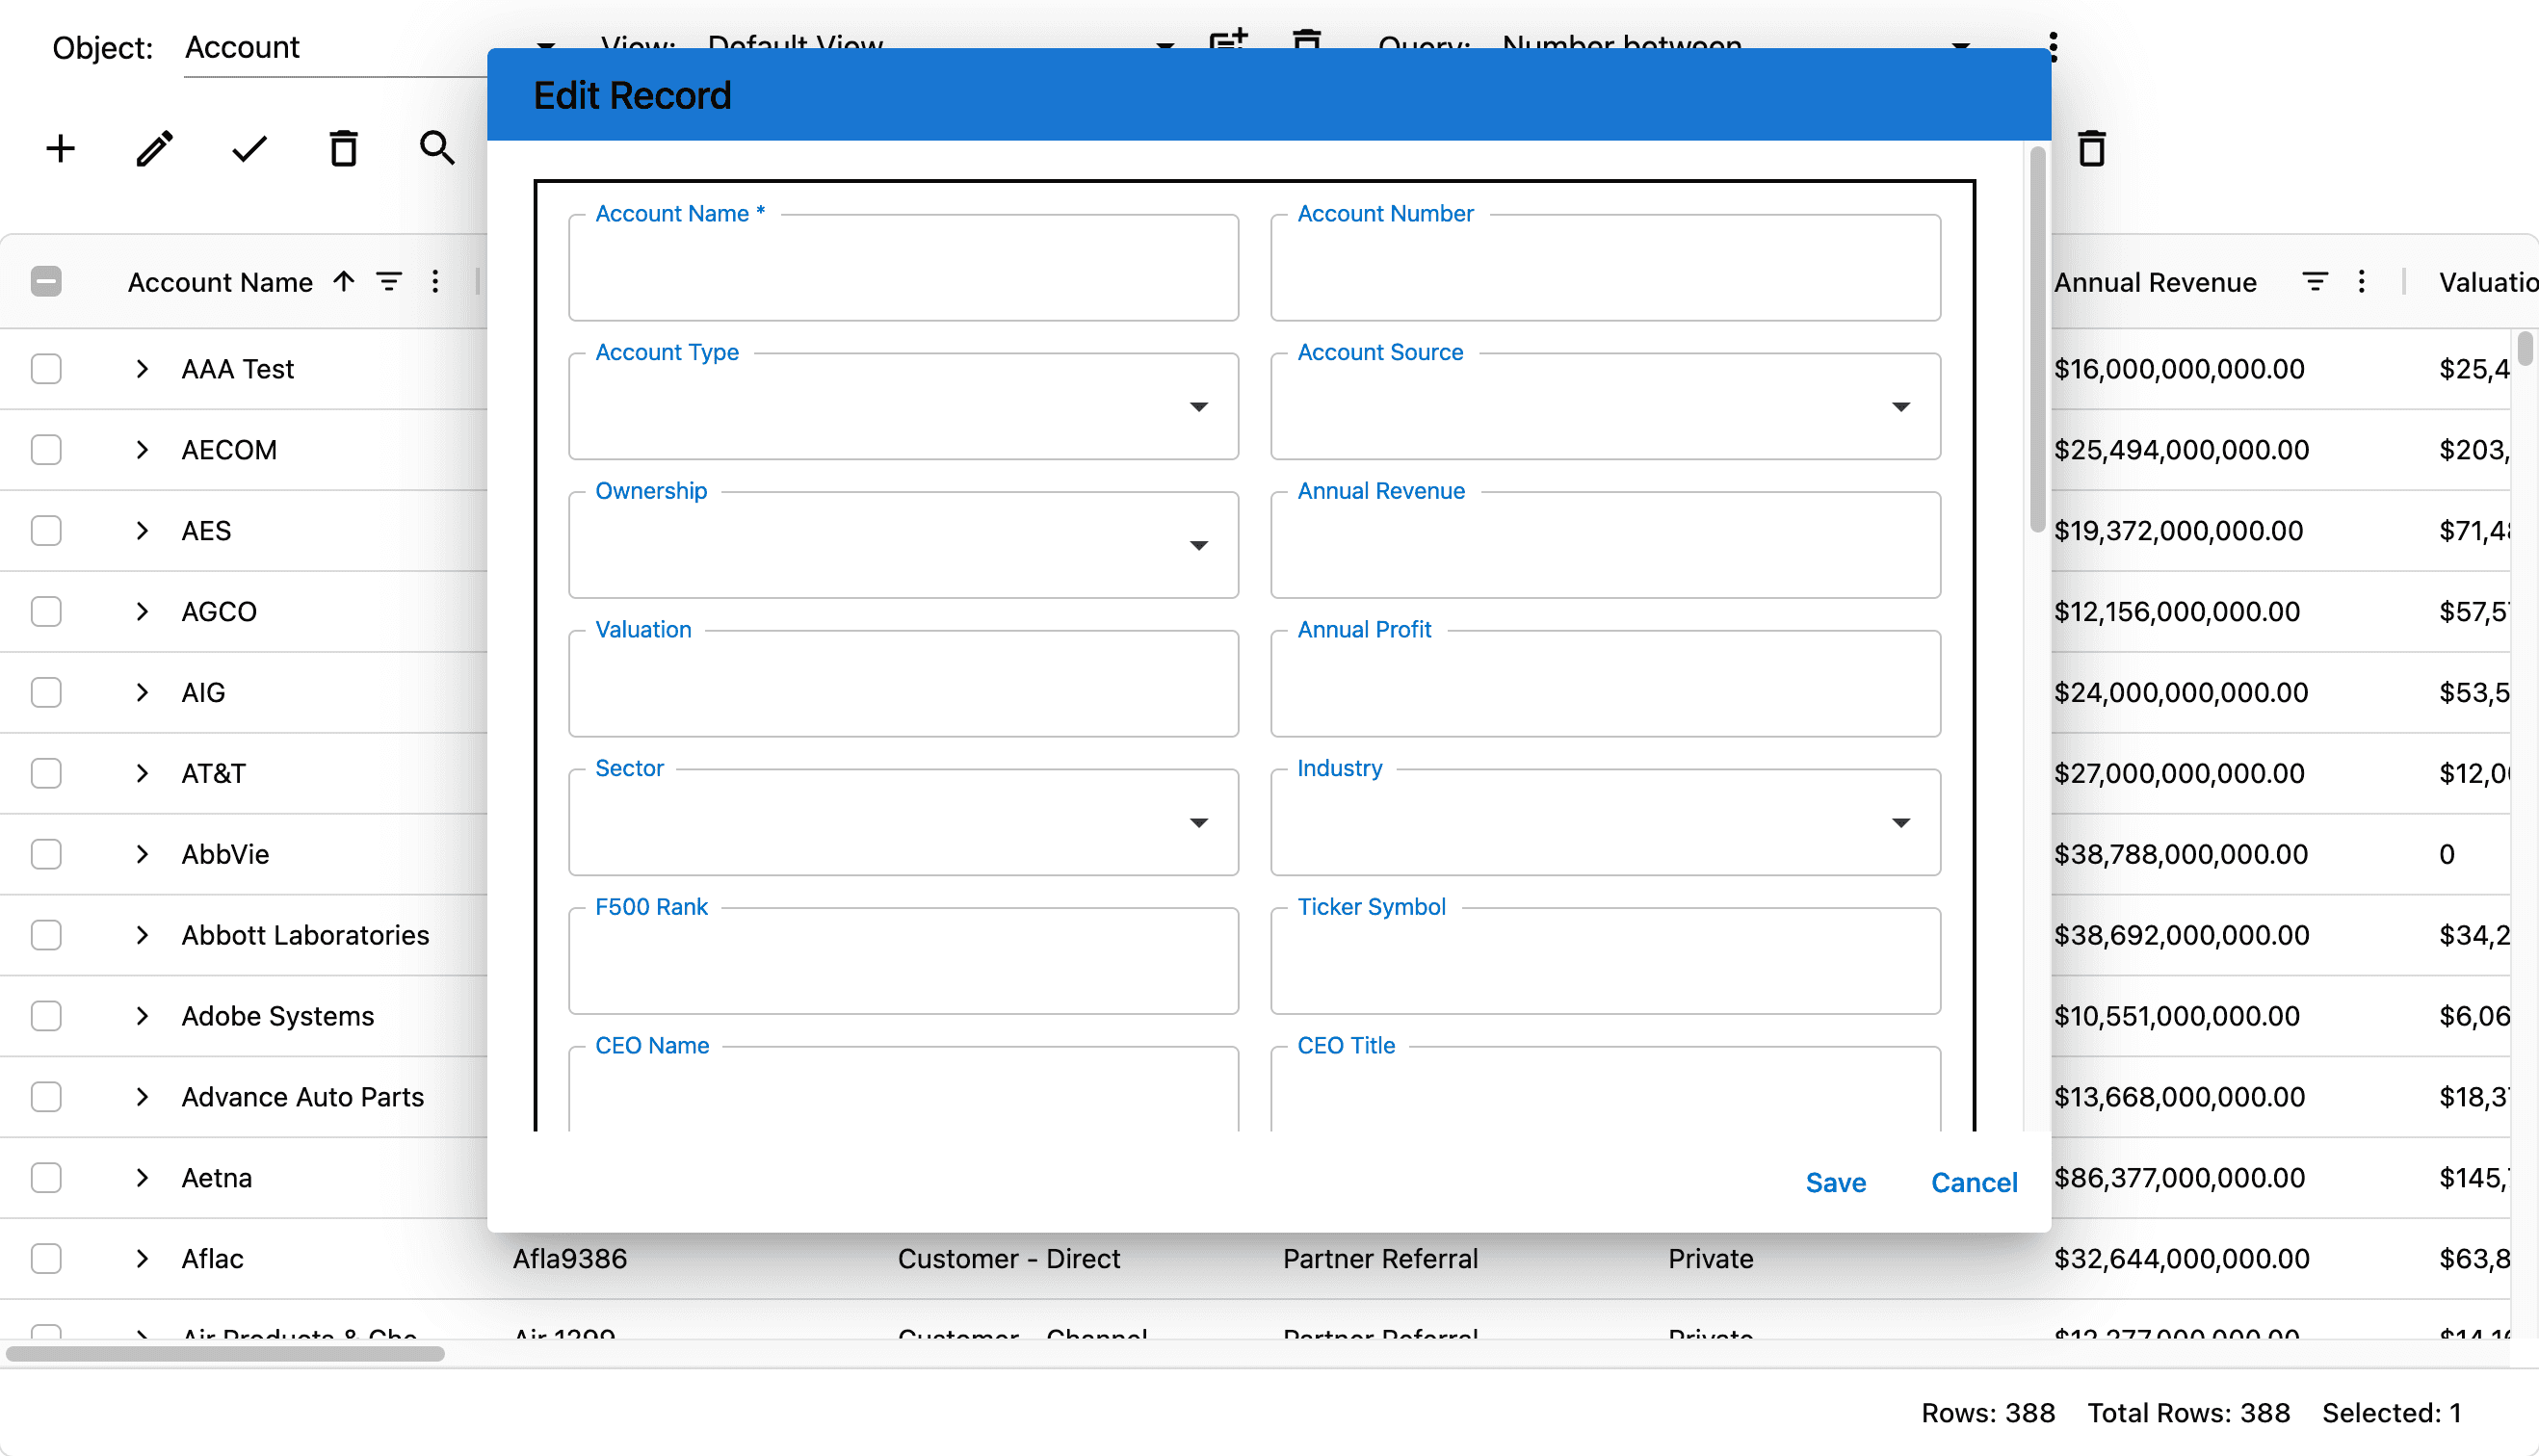
Adding grid records
To create a grid record, click the Add button in the grid toolbar. An edit form will be displayed.
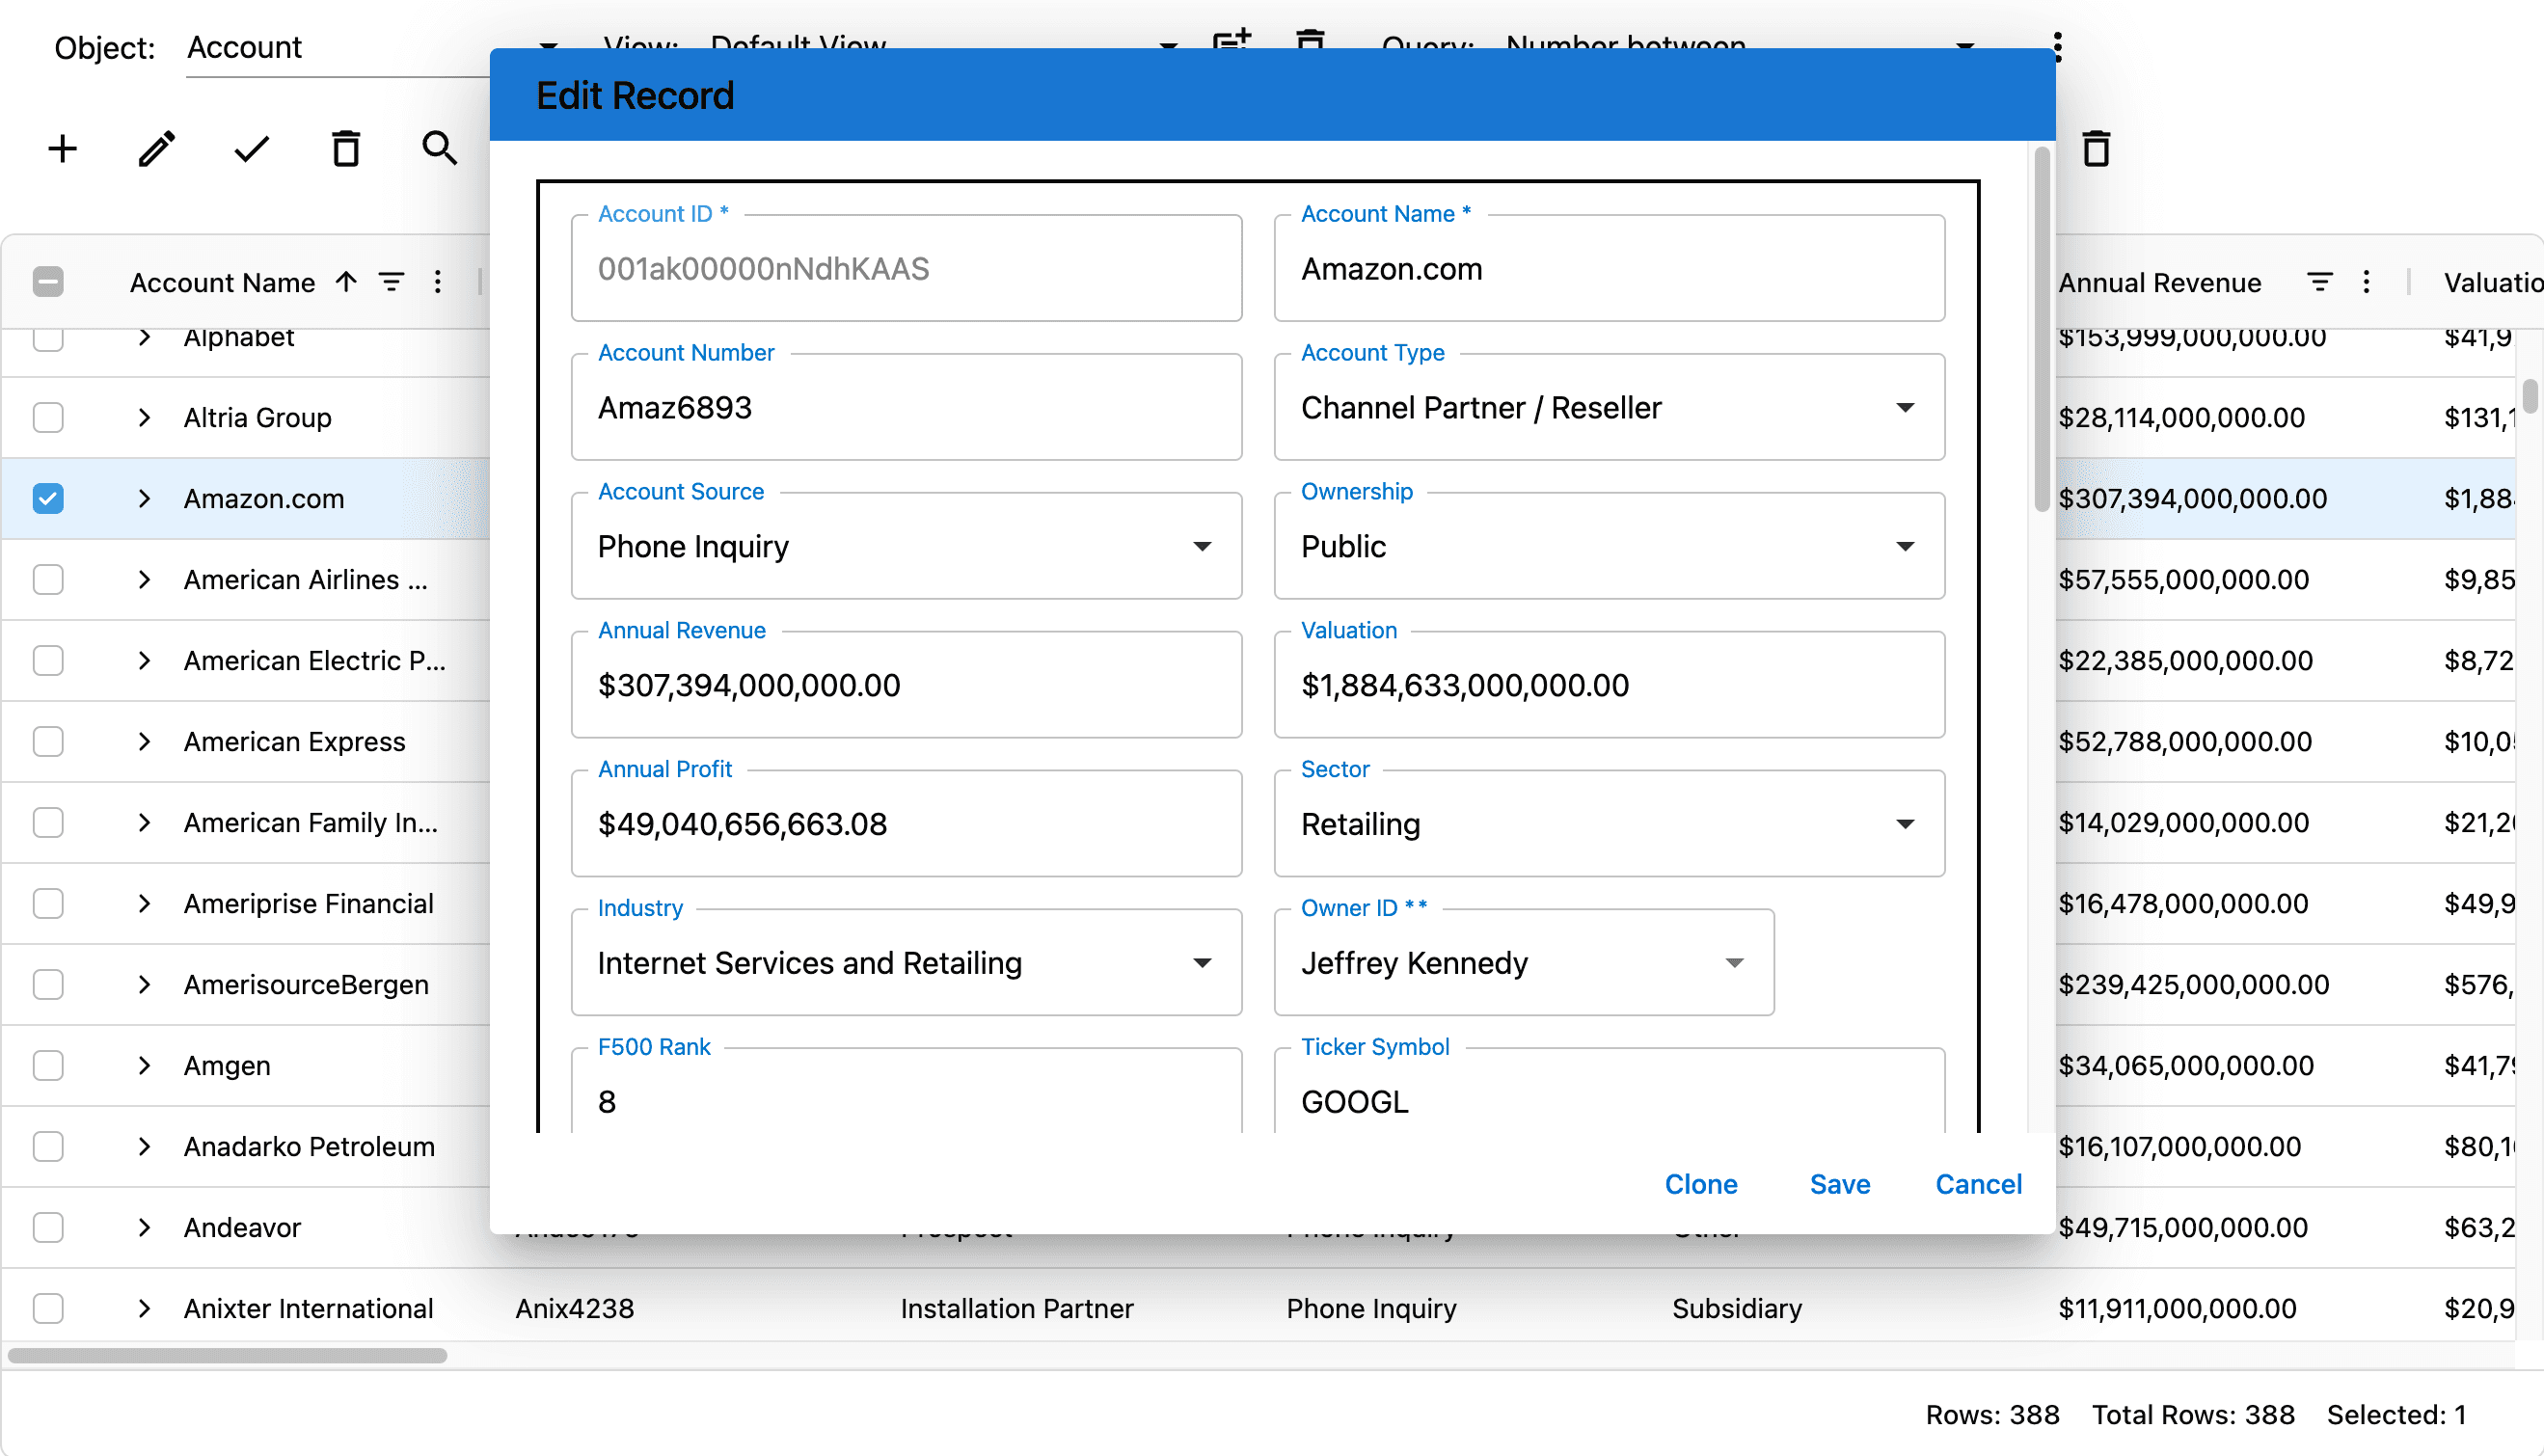
Editing grid records
AppGrid provides the ability to edit records in-line or using a form. To edit inline, double click the column and an editor that is appropriate for the column type will be displayed. To edit the record in a form, select the record checkbox and click the Edit button in the grid toolbar. The record edit form will be displayed.
Deleting grid records
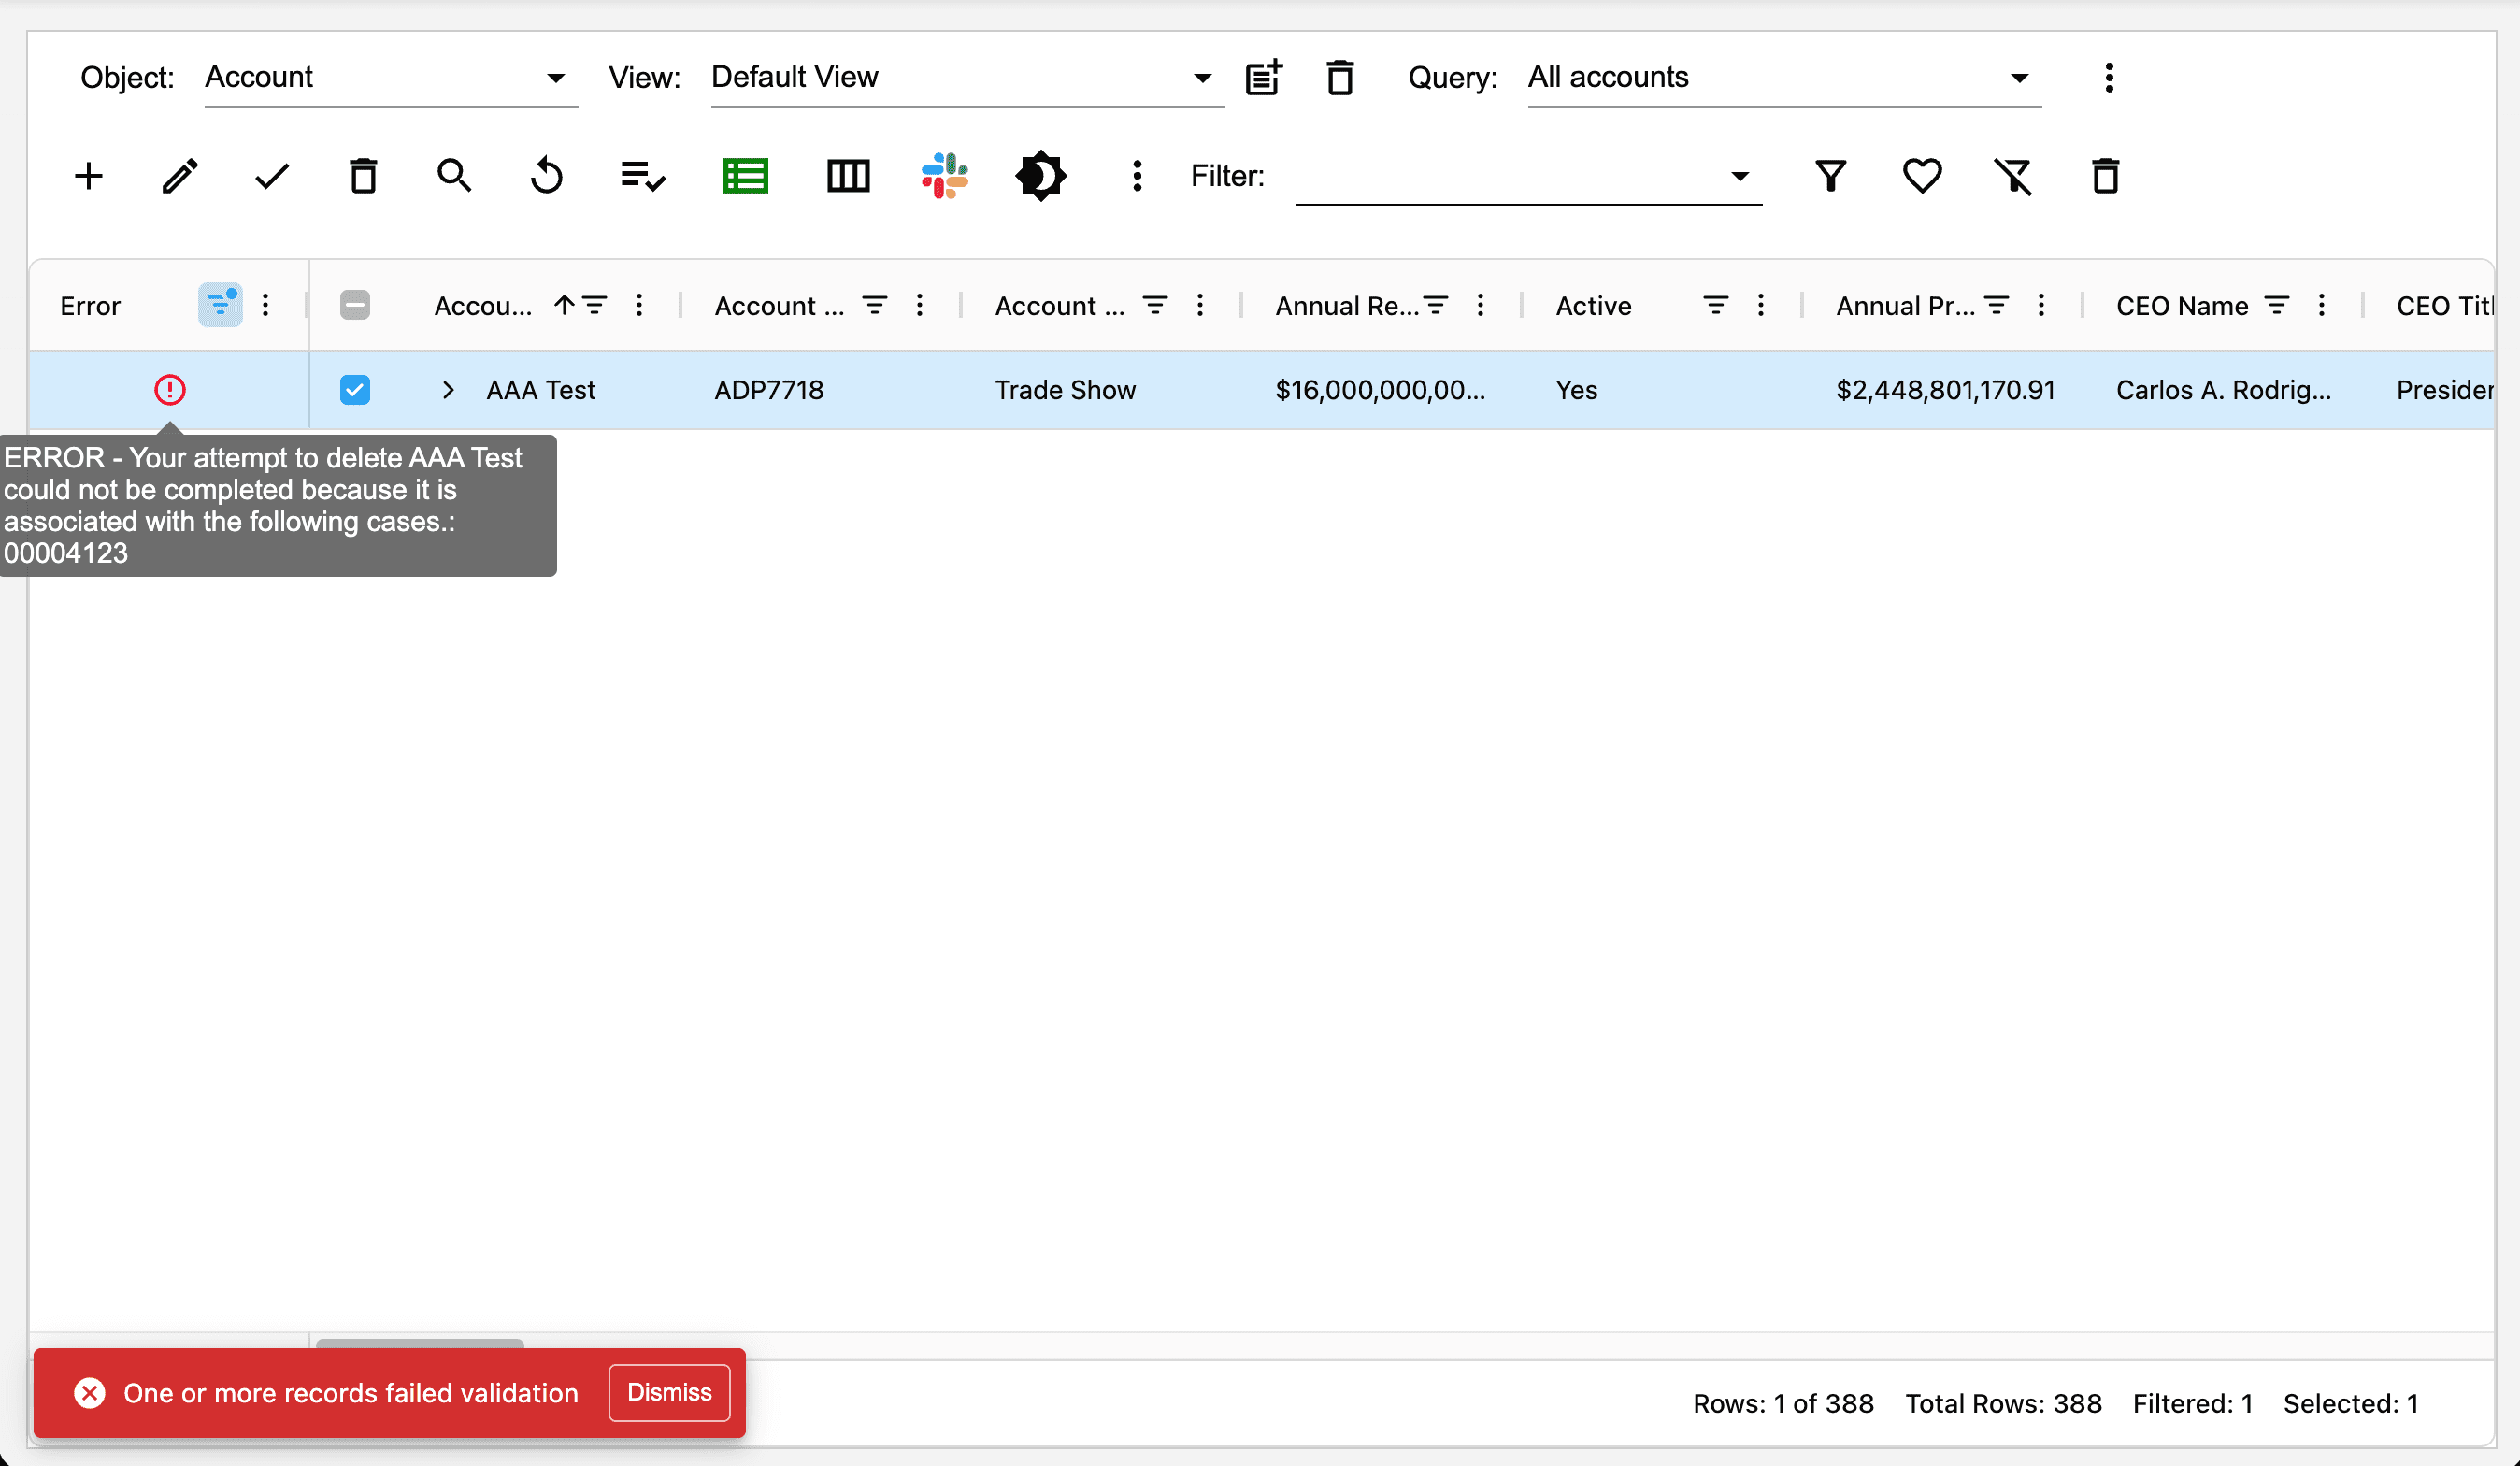
Select one or more records by clicking the row checkbox. Click the delete button in the grid toolbar. A delete confirmation will be shown. AppGrid provides the ability to mass delete many records at once because the delete operation is batched. The Apex DML governor limit is 10,000 records per transaction which is no longer an issue with AppGrid.
If any errors occur when deleting records, the grid will filter to show the records that have errors. You can hover over the error icon to see the error message. After reviewing the errors, click the clear filters icon to reload the query result.
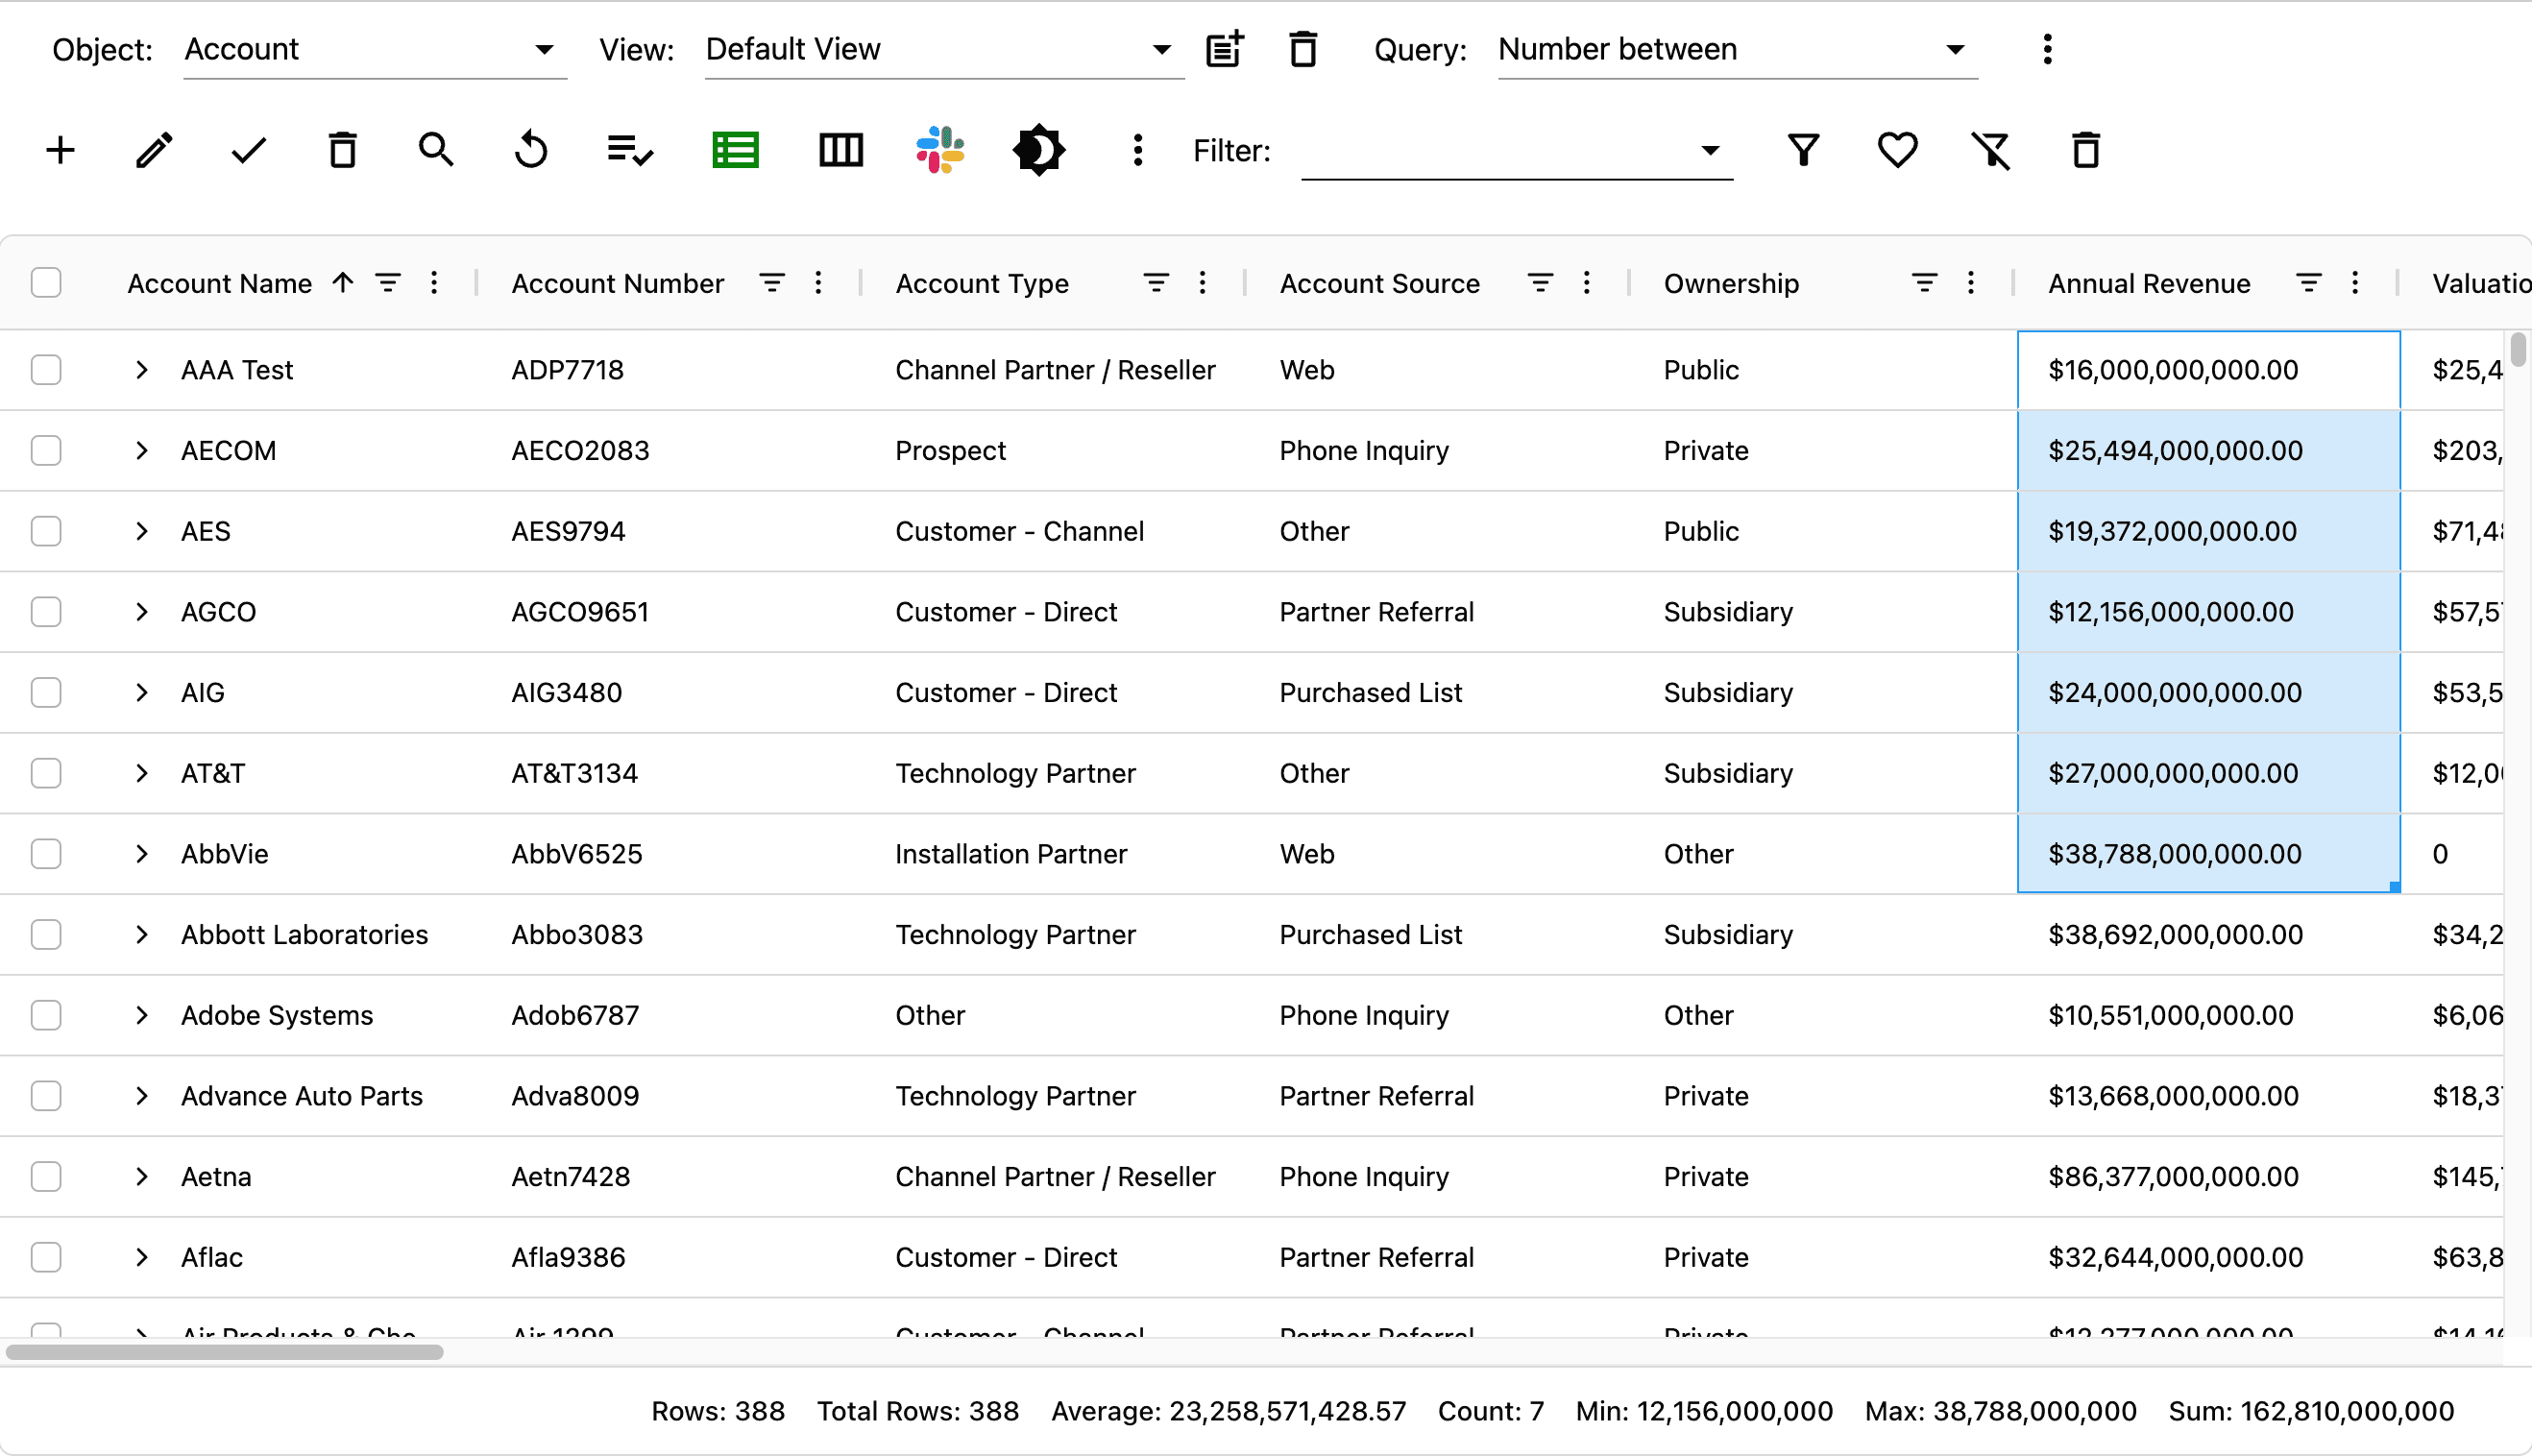
Drag select
AppGrid provides the ability to perform aggregations on column values. Click and drag across coumn values. In the grid footer, you will see the aggregated values.
Undo / redo edits
AppGrid provides the ability to undo edits. Enter Cmd+Z (Cntrl+Z on Windows) to reverse the last edit. You can undo a total of the last 30 edits. To restore an edit, enter Cmd+Shift+Z (Cntrl+Shift+Z on Windows).
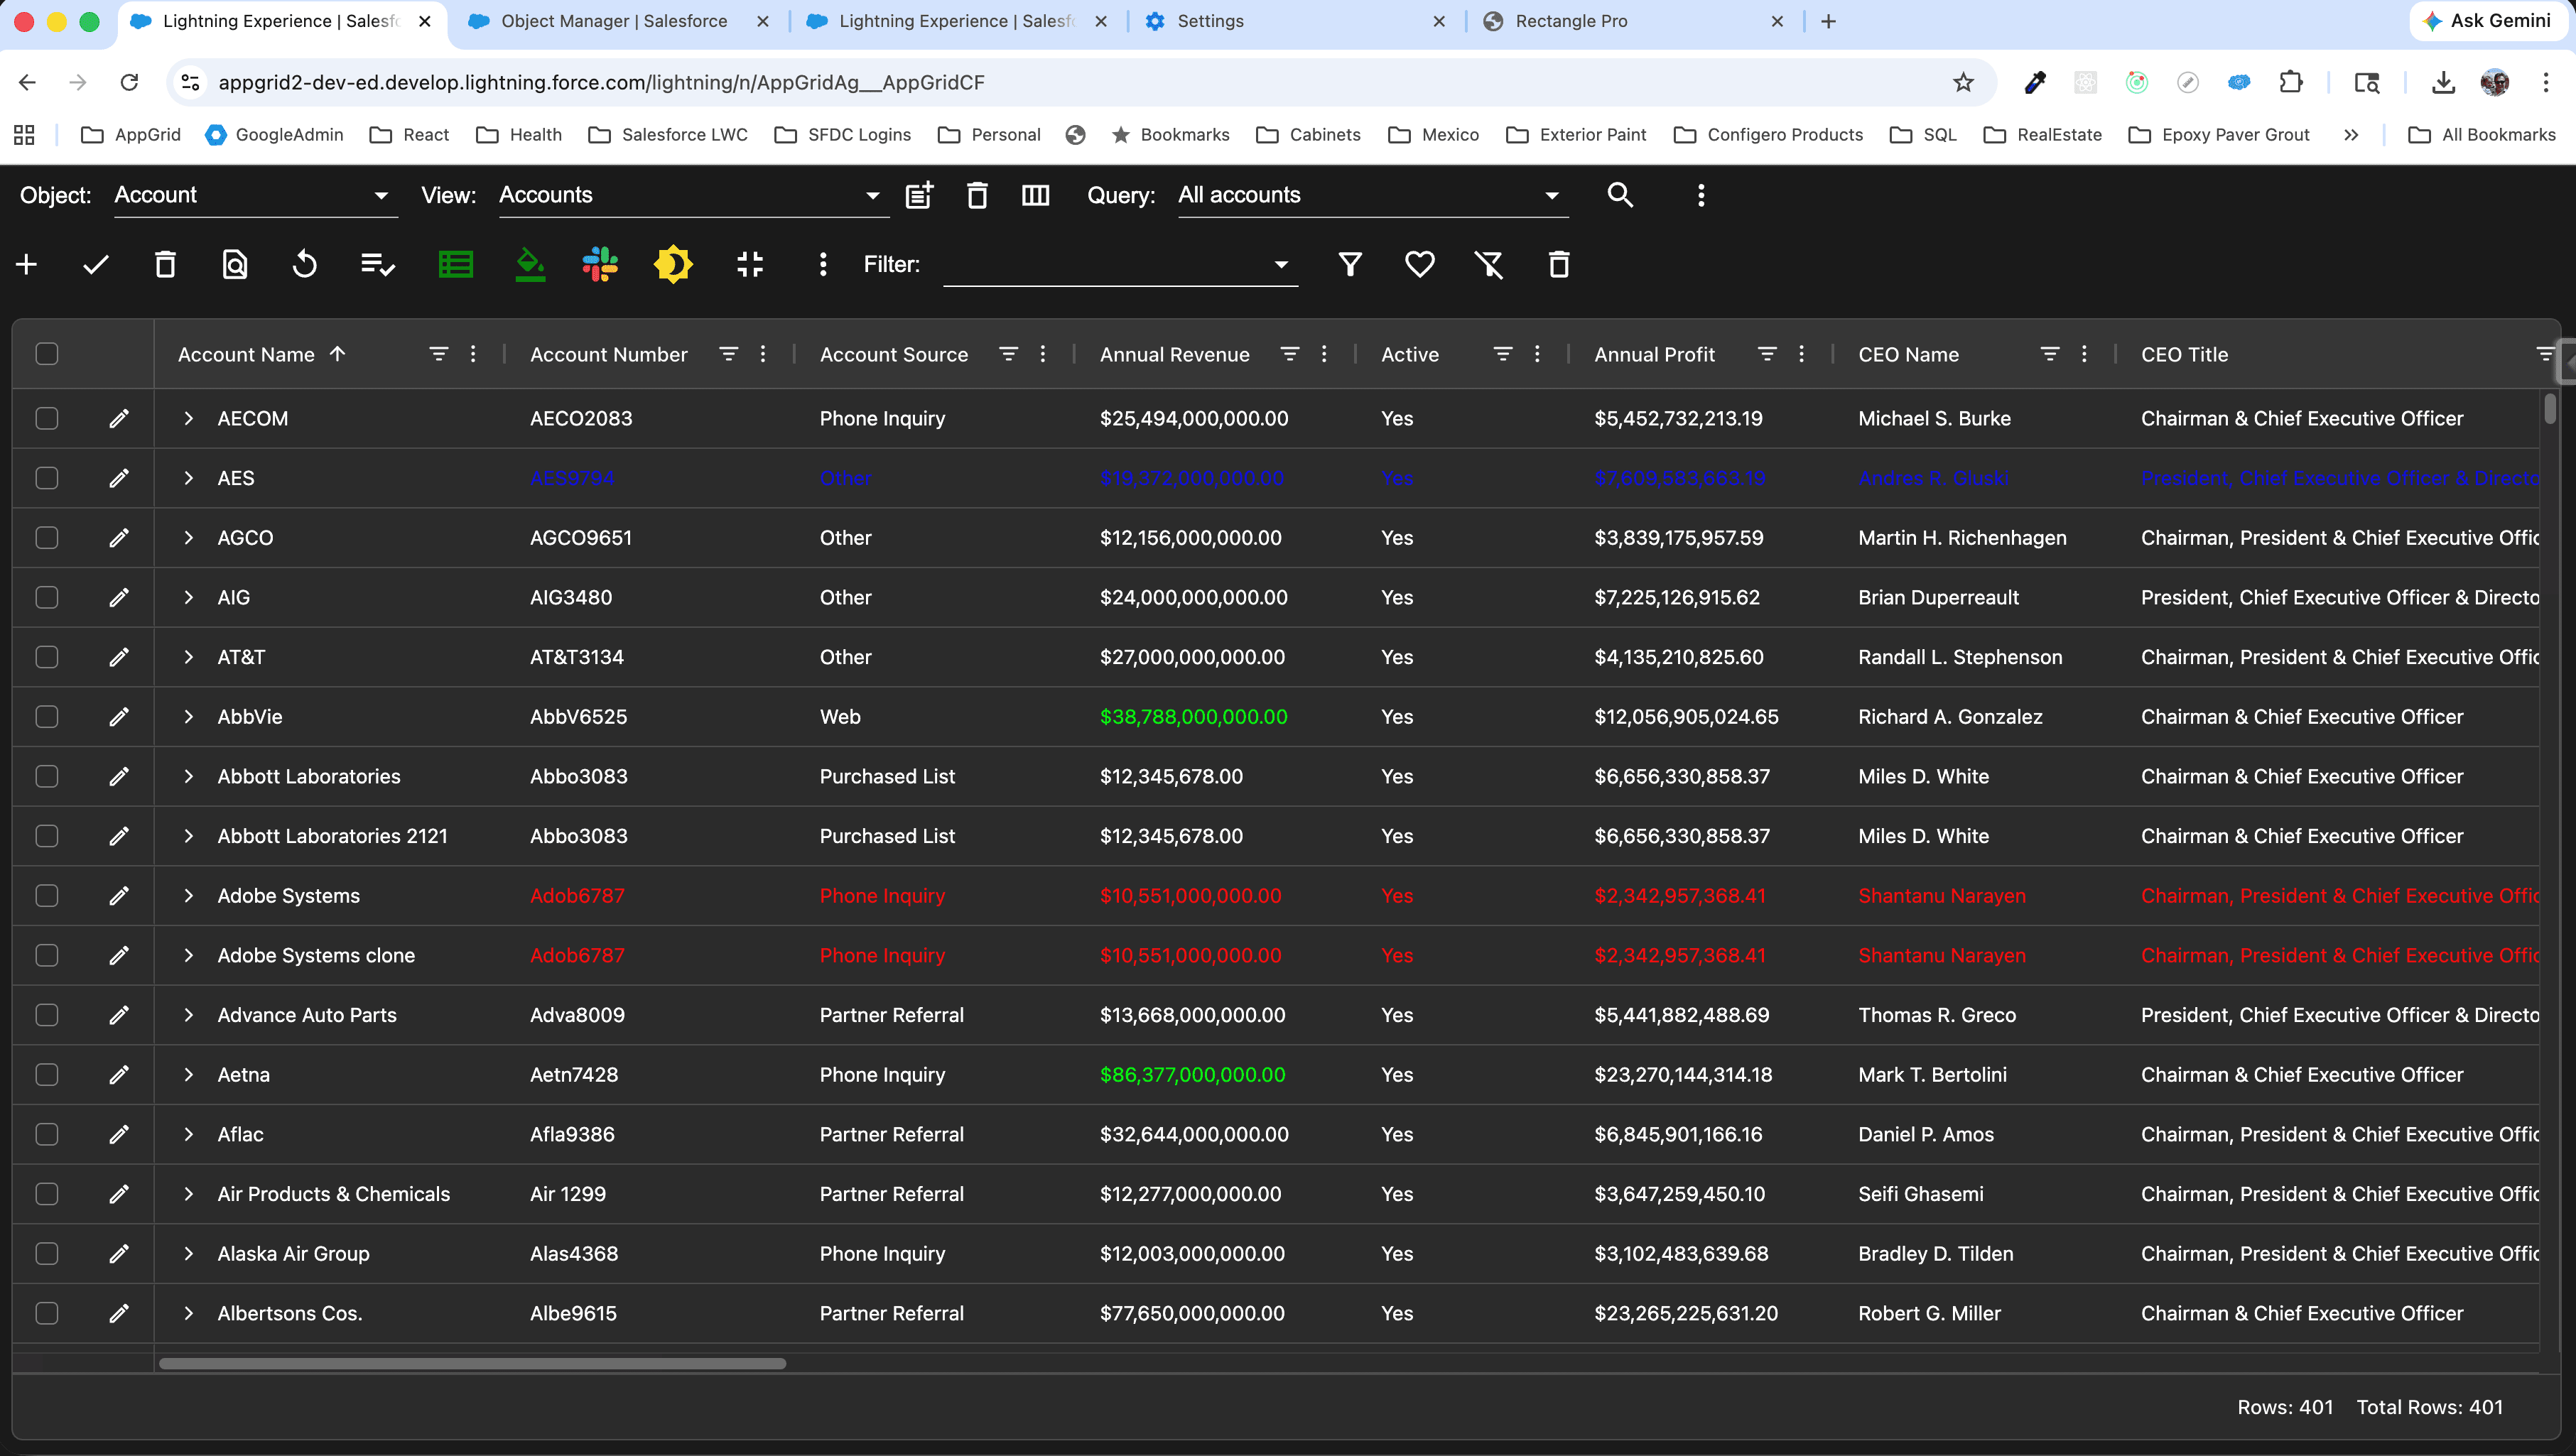
Fullscreen mode
One our most favorite features is the ability to switch AppGrid to fullscreen mode. This free's up alot of space to display more of your data.
Change owner
AppGrid brings Change Owner functionality directly into the data grid, with full support for both single-record and bulk transfers.
Annual Account reassignments involving thousands (and often much more) of records are done quite often in enterprise B-to-C companies and we designed this feature with them in mind.
Right-click any row to reassign ownership to a different user or queue, optionally cascading the transfer to related records — open opportunities, cases, contacts, attachments, and more — exactly as Salesforce's standard UI does. Select multiple rows and the dialog adapts: it shows record counts, batches the work intelligently, and reports per-record outcomes when the transfer completes.
What sets the AppGrid implementation apart is its focus on safety and observability for large-scale operations. Bulk transfers are chunked conservatively based on the number of cascade options selected — keeping each batch comfortably within Salesforce governor limits even when transferring hundreds or thousands of records with all related-record cascades enabled.
A confirmation gate appears for selections of 100 or more records, letting users review the operation before committing. While batches run, users can cancel the operation gracefully — the in-flight batch completes cleanly and the rest are clearly marked as not attempted.
After completion, a detailed summary panel reports exactly what transferred, what was skipped (and why), and lets administrators export the results to CSV or selectively retry failed records through an inline editable grid.
For the largest cascades — accounts with thousands of contacts, for example — the underlying Apex transparently paginates the work to keep heap usage bounded, so transfers that would break the native implementation simply succeed.
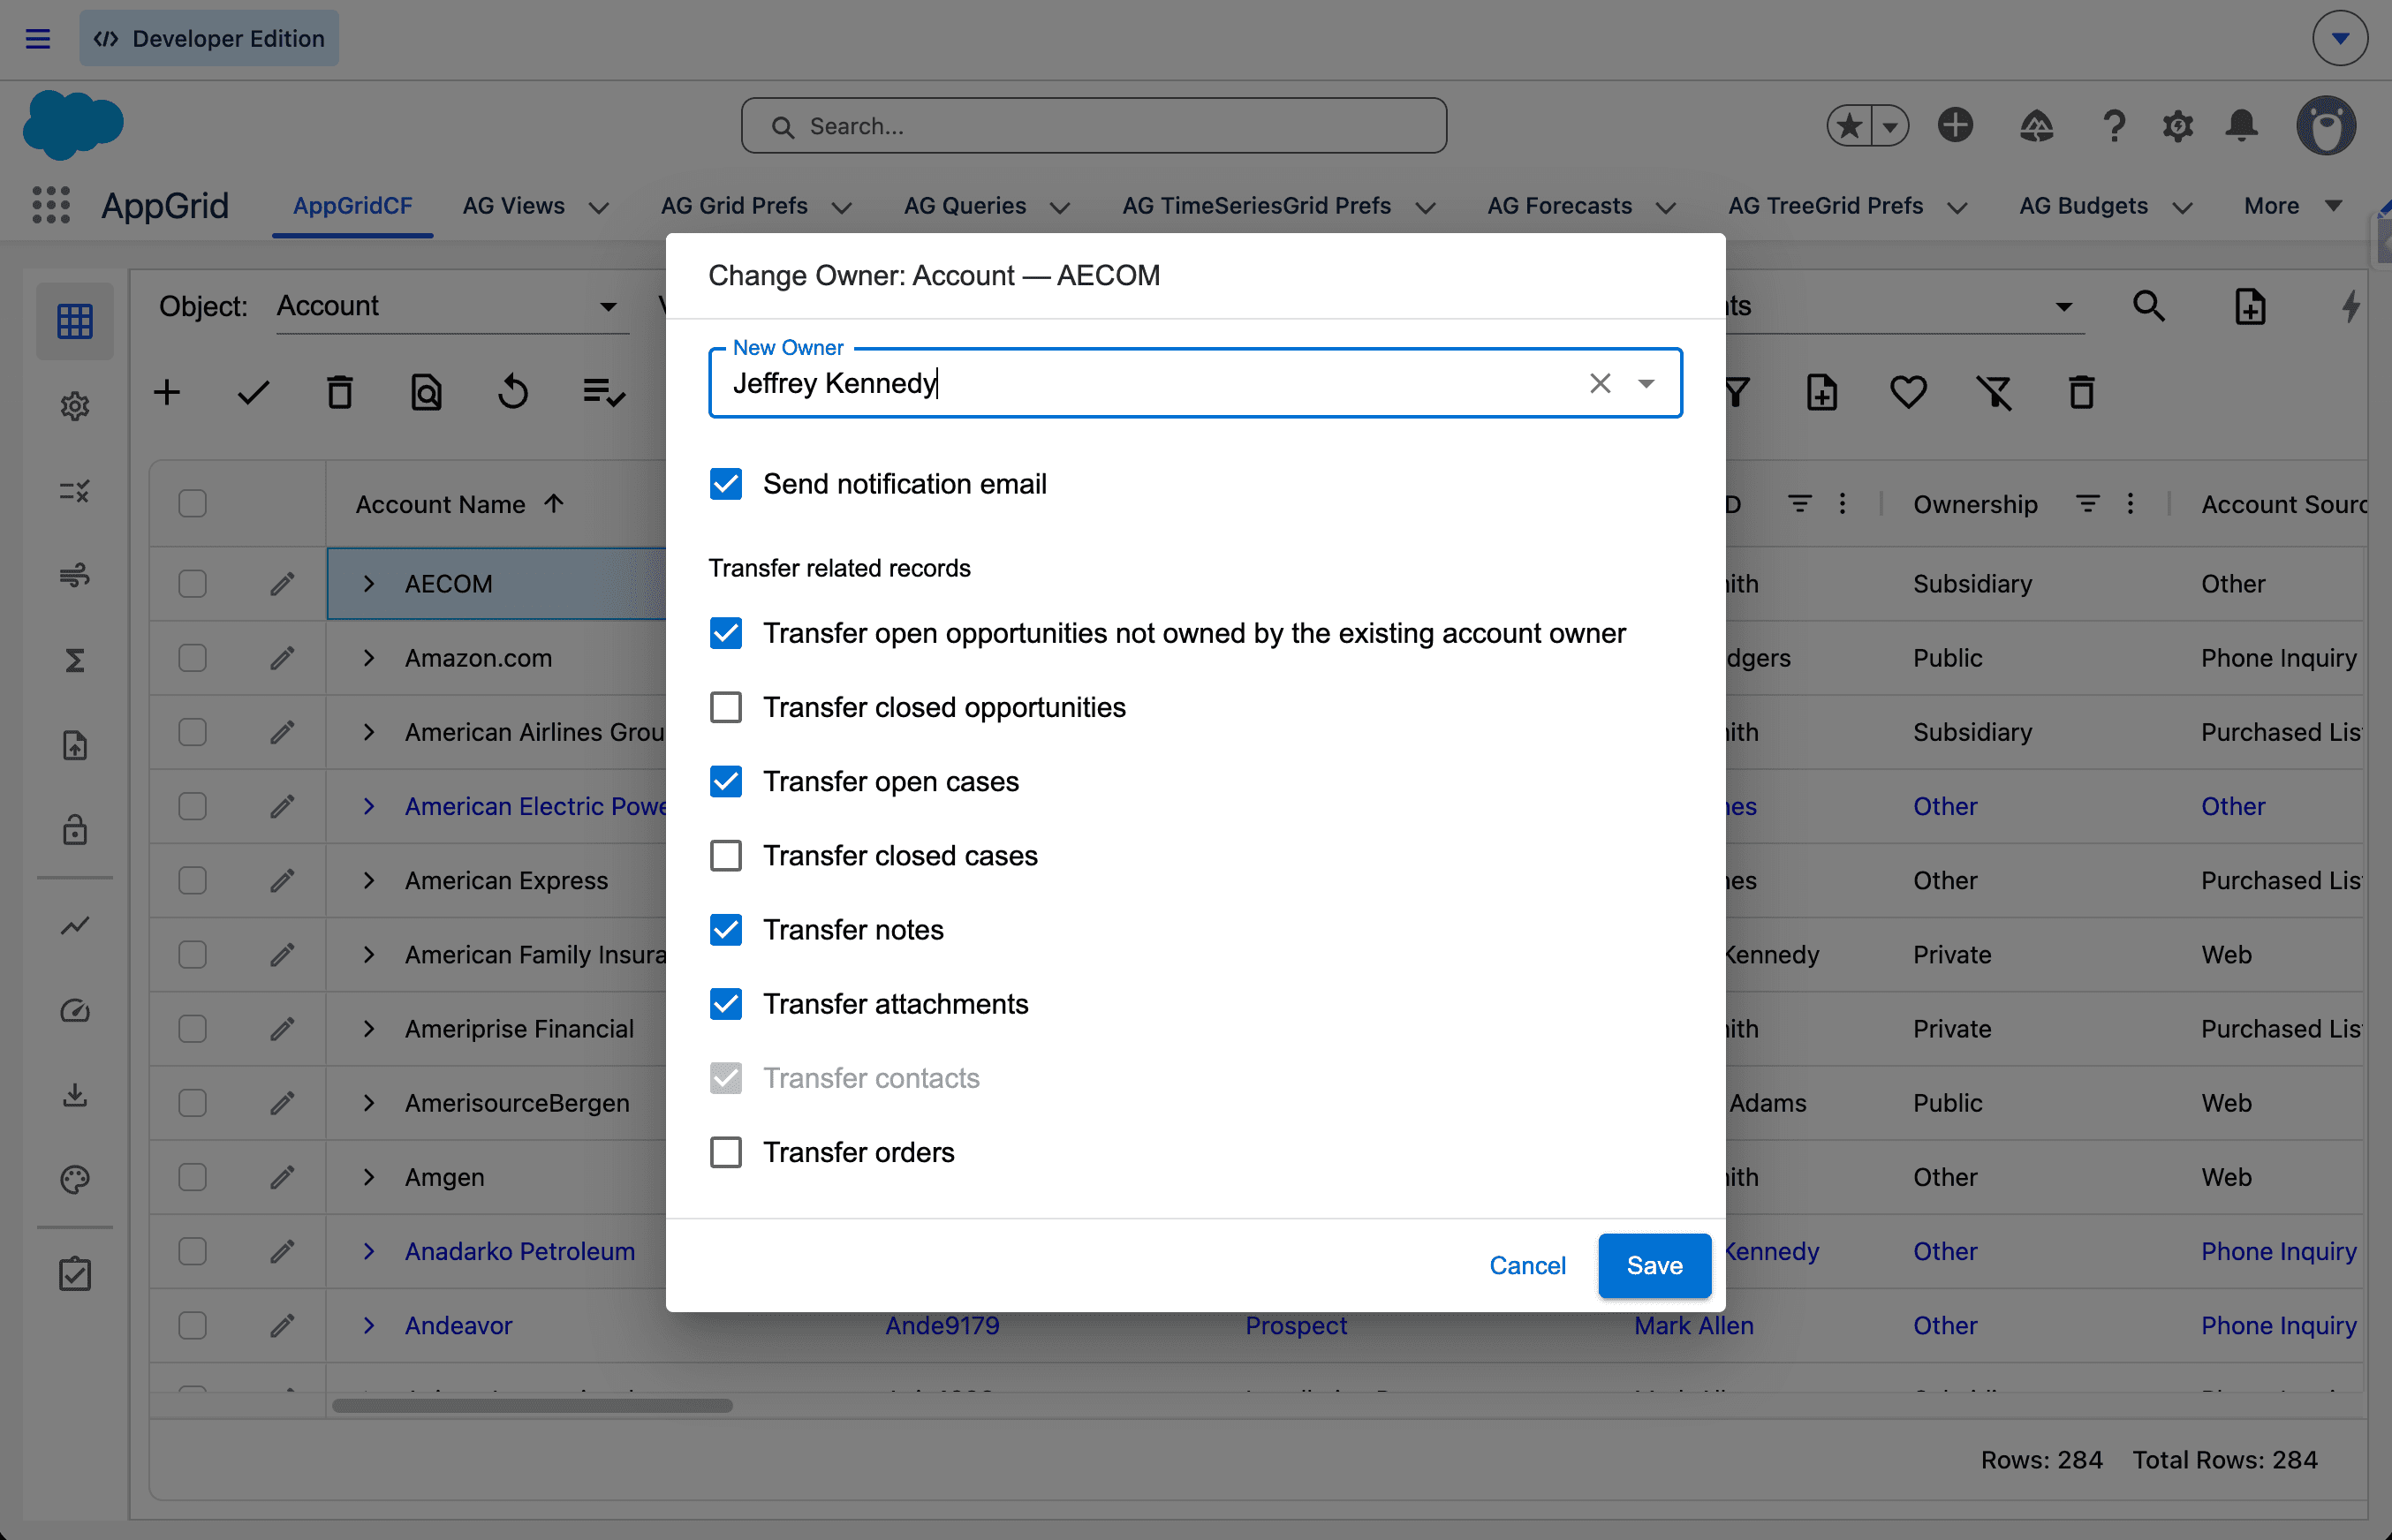
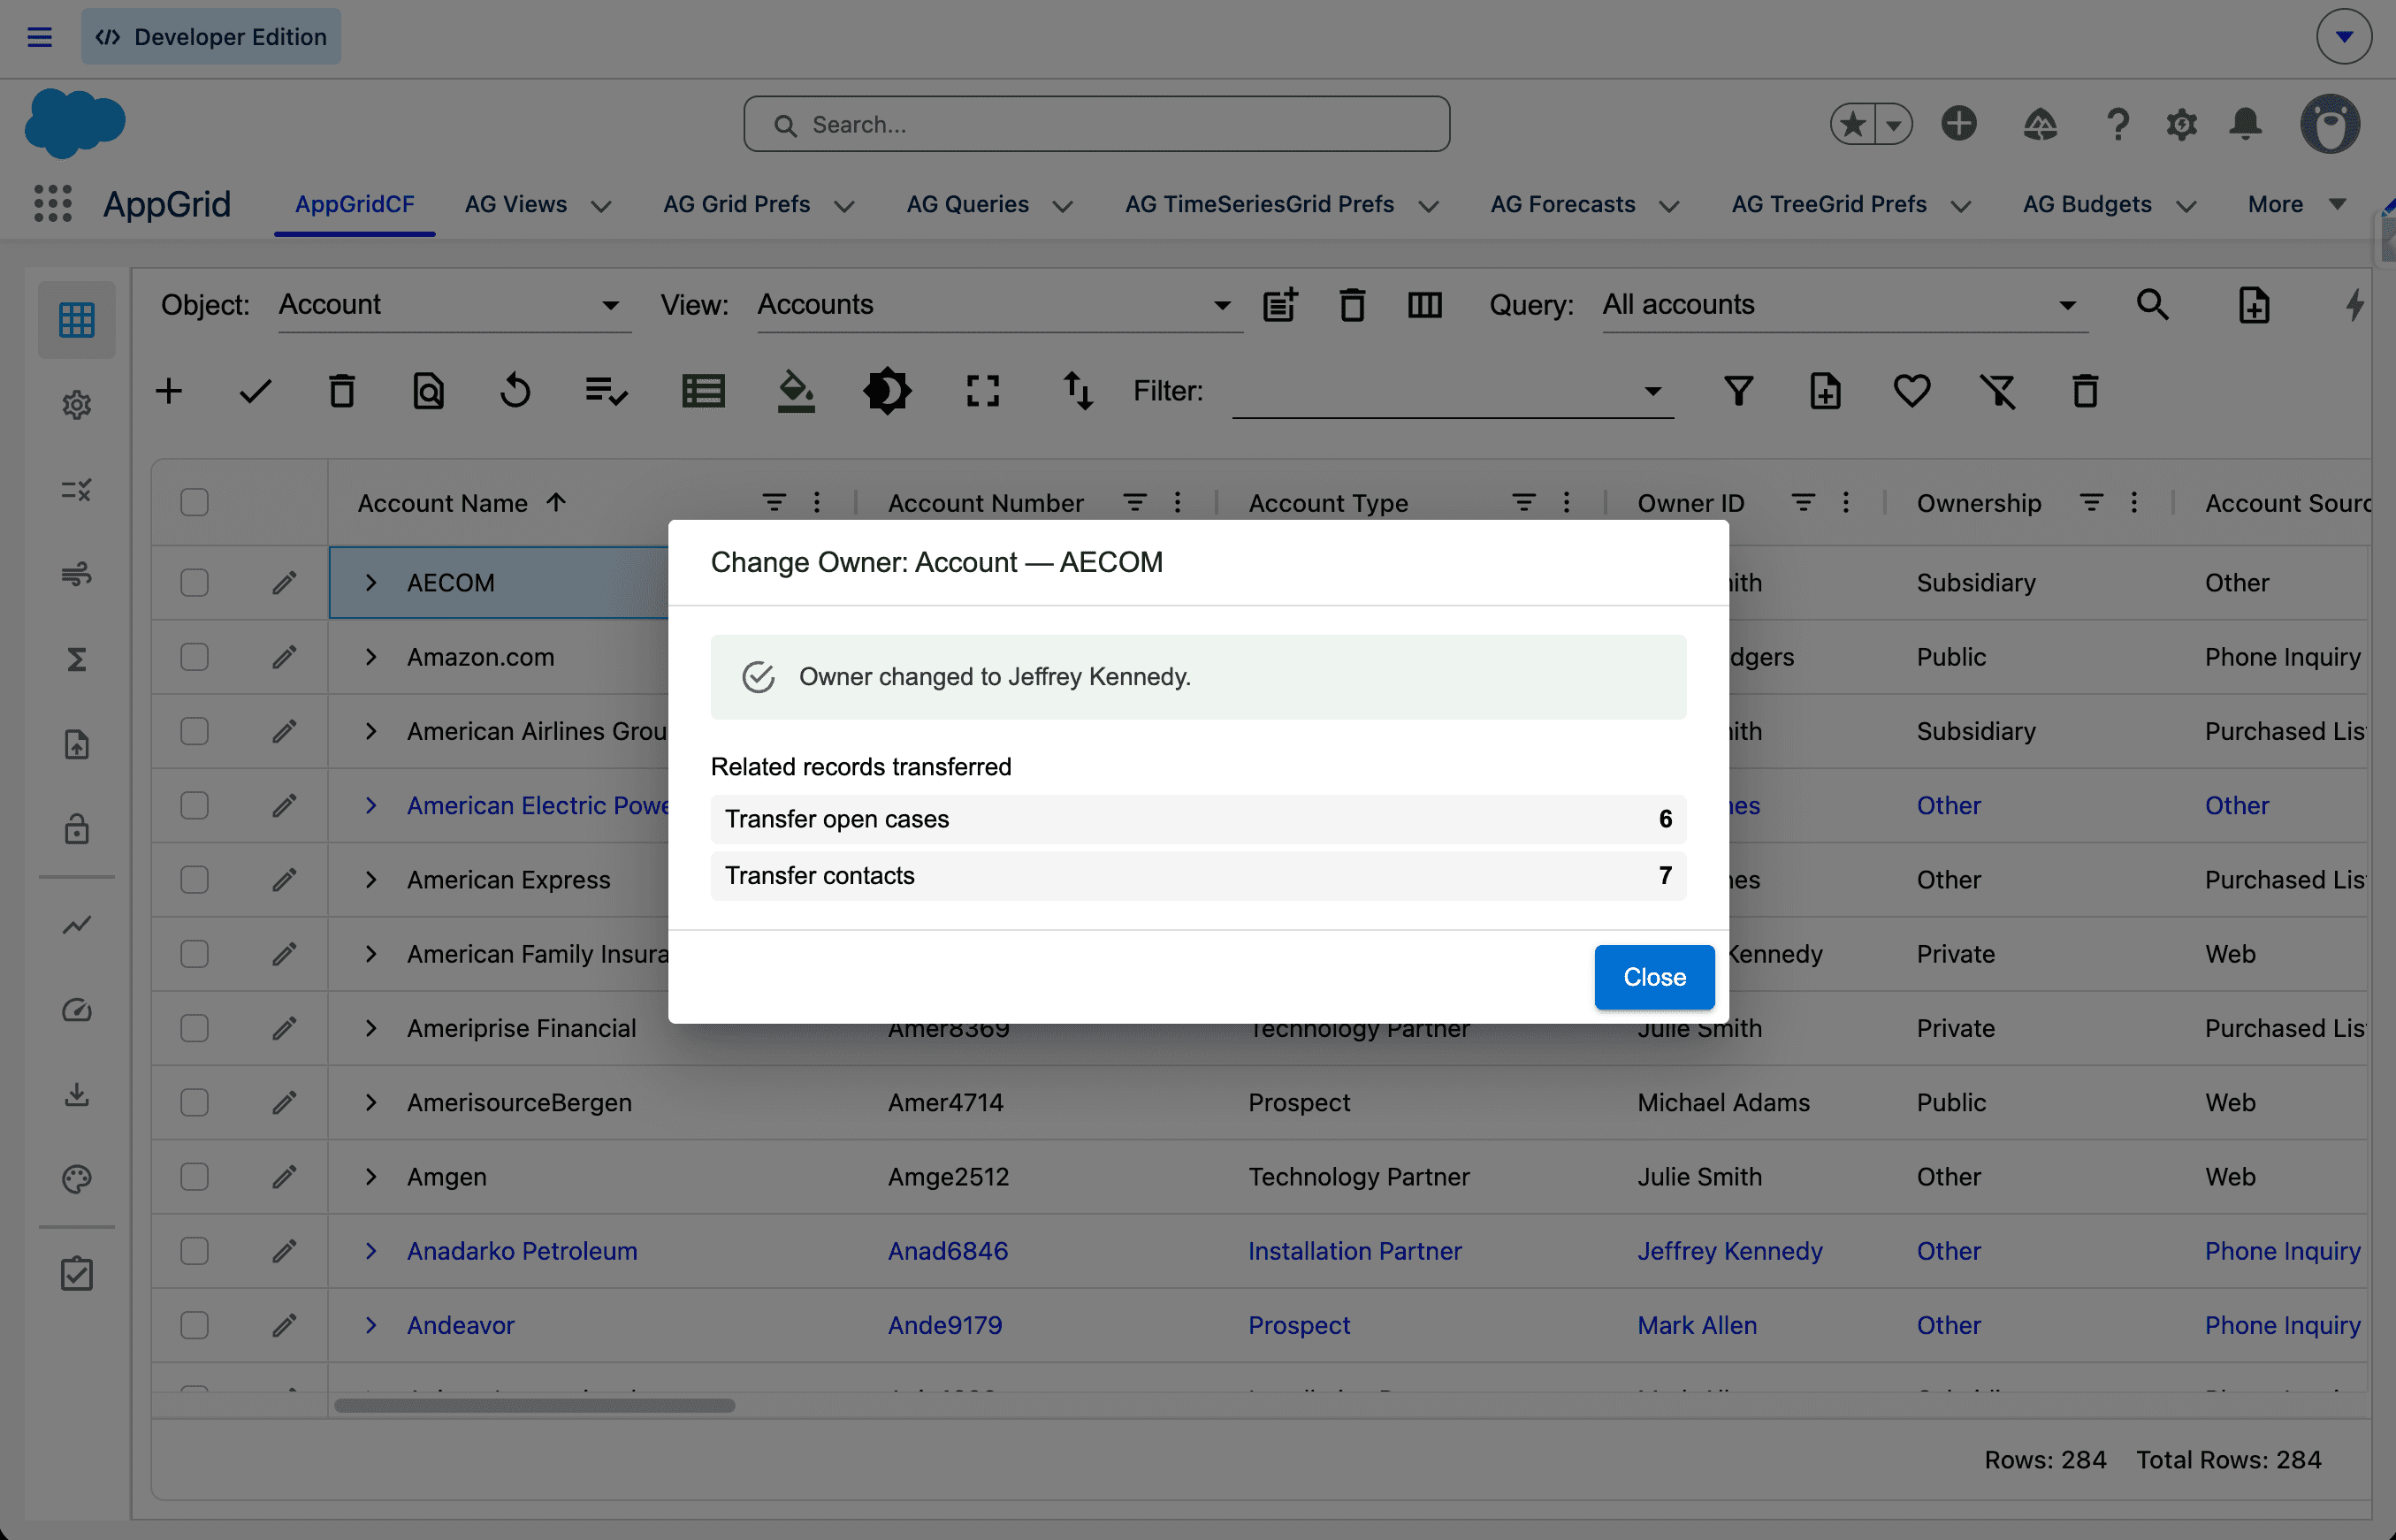
You can choose what actions are performed when the record owner is changed. Click the Save button to execute the ownership change. A summary is provided after the operation is performed and the query is refreshed.
Converting leads
The AppGrid lead conversion wizard transforms lead conversion from a one-record-at-a-time chore into a structured, data-aware bulk workflow.
The unified five-tab wizard (Settings → Account → Contact → Opportunity → Review) walks users through global decisions once, then applies them across every selected lead — while still letting each lead carry its own resolution.
Per-row grids in the Account, Contact, and Opportunity tabs show every lead alongside an intelligent Match column that combines three layered signals: Salesforce's own Duplicate Management rules (the green "Match rule" chip), full-text fuzzy search via SOSL (the cyan "Fuzzy match" chip that catches typos like "Abbot Insurnace" → "Abbott Insurance"), and exact-substring fallback.
High-confidence matches are auto-selected on dialog open; everything else is surfaced through a clear dropdown that lets users pick any candidate or fall back to creating a new record.
Submission runs in chunked batches with per-batch progress, "Cancel after current batch" between chunks, an AG Grid retry view for failures, and CSV export of skipped rows.
Salesforce's built-in Convert button operates on a single lead at a time and offers no real bulk path — sales ops teams typically resort to paid third-party apps to do what AppGrid does natively. AppGrid surfaces fuzzy and rule-based duplicate matches inline at the moment of decision, so leads with company-name typos don't silently spawn duplicate Accounts.
Each lead in a batch can route to a different existing Account (or create a new one), get its own Opportunity name, or skip Opportunity creation independently — the native UI forces uniform decisions or per-record clicks.
The chunked execution model with cancellation, partial-success reporting, and selective retry gives sales operations confidence to convert hundreds of leads without fear of all-or-nothing failures, while the global Settings tab eliminates the repetitive per-record clicks (Converted Status, Owner, Send notification email) that make native conversion painful at scale.
This is another stellar example of how the power of AppGrid can deliver real value and productivity gains.
Let's look at the lead conversion process. Select one or more lead records and right-click. Choose the Convert Leads menu item. The first page of the lead conversion wizard will be displayed.
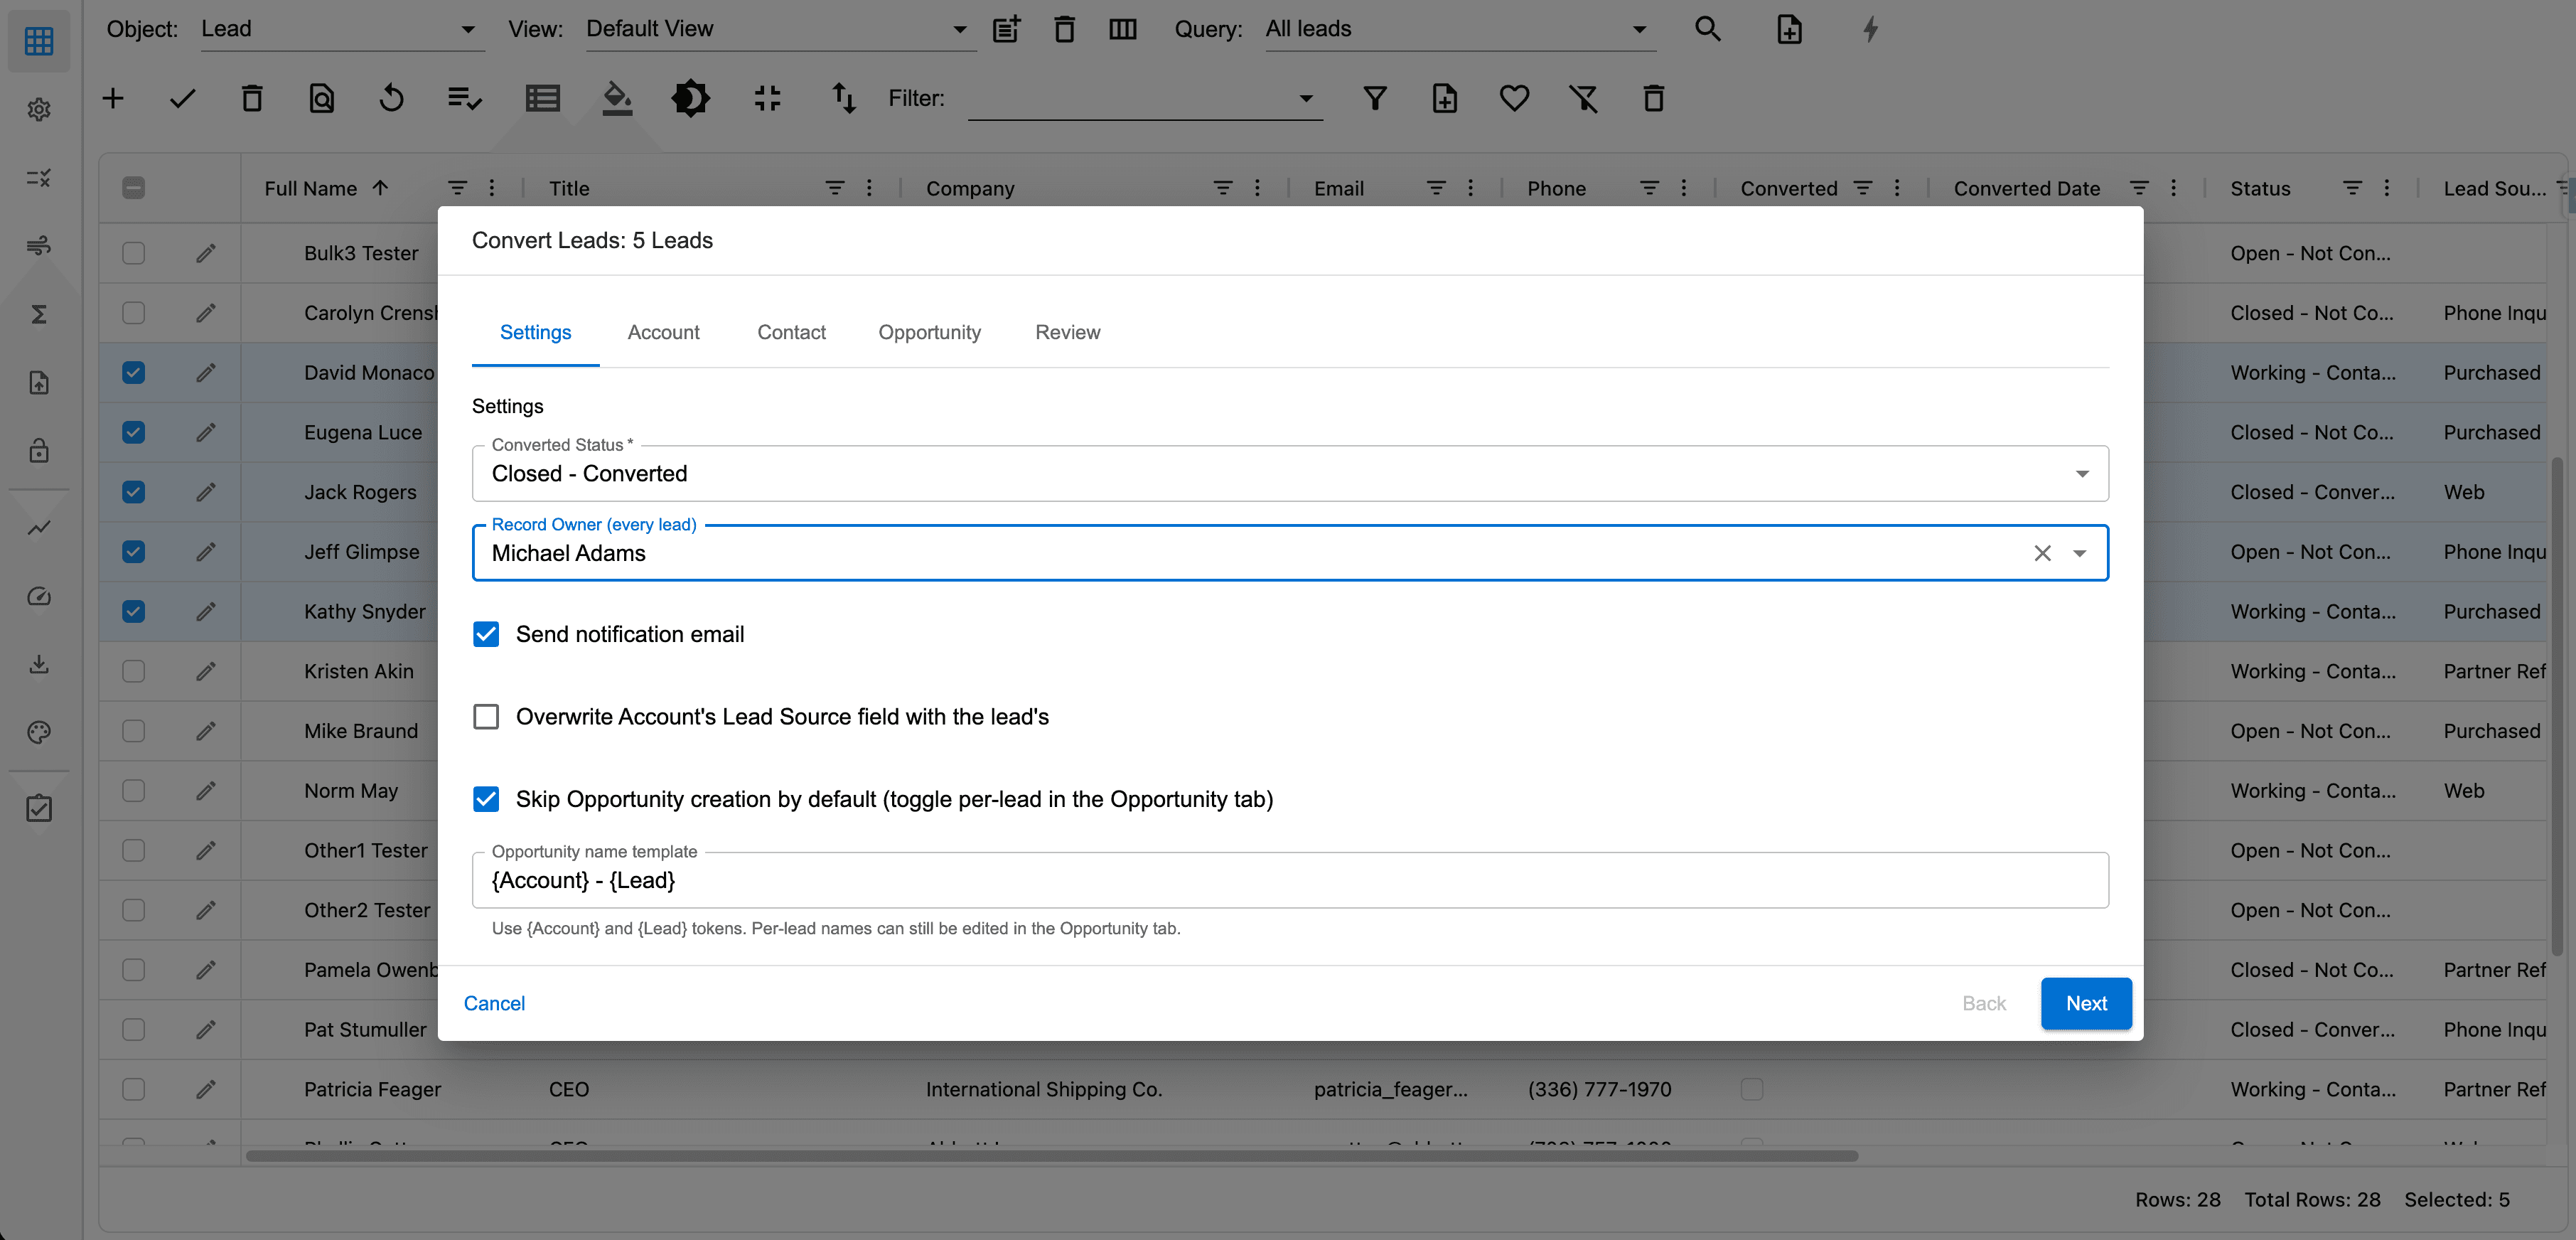
Search for and select the record owner who will be assigned the new records. The first wizard page allows us to set global actions for the lead conversion process. Check your preferences and click Next.
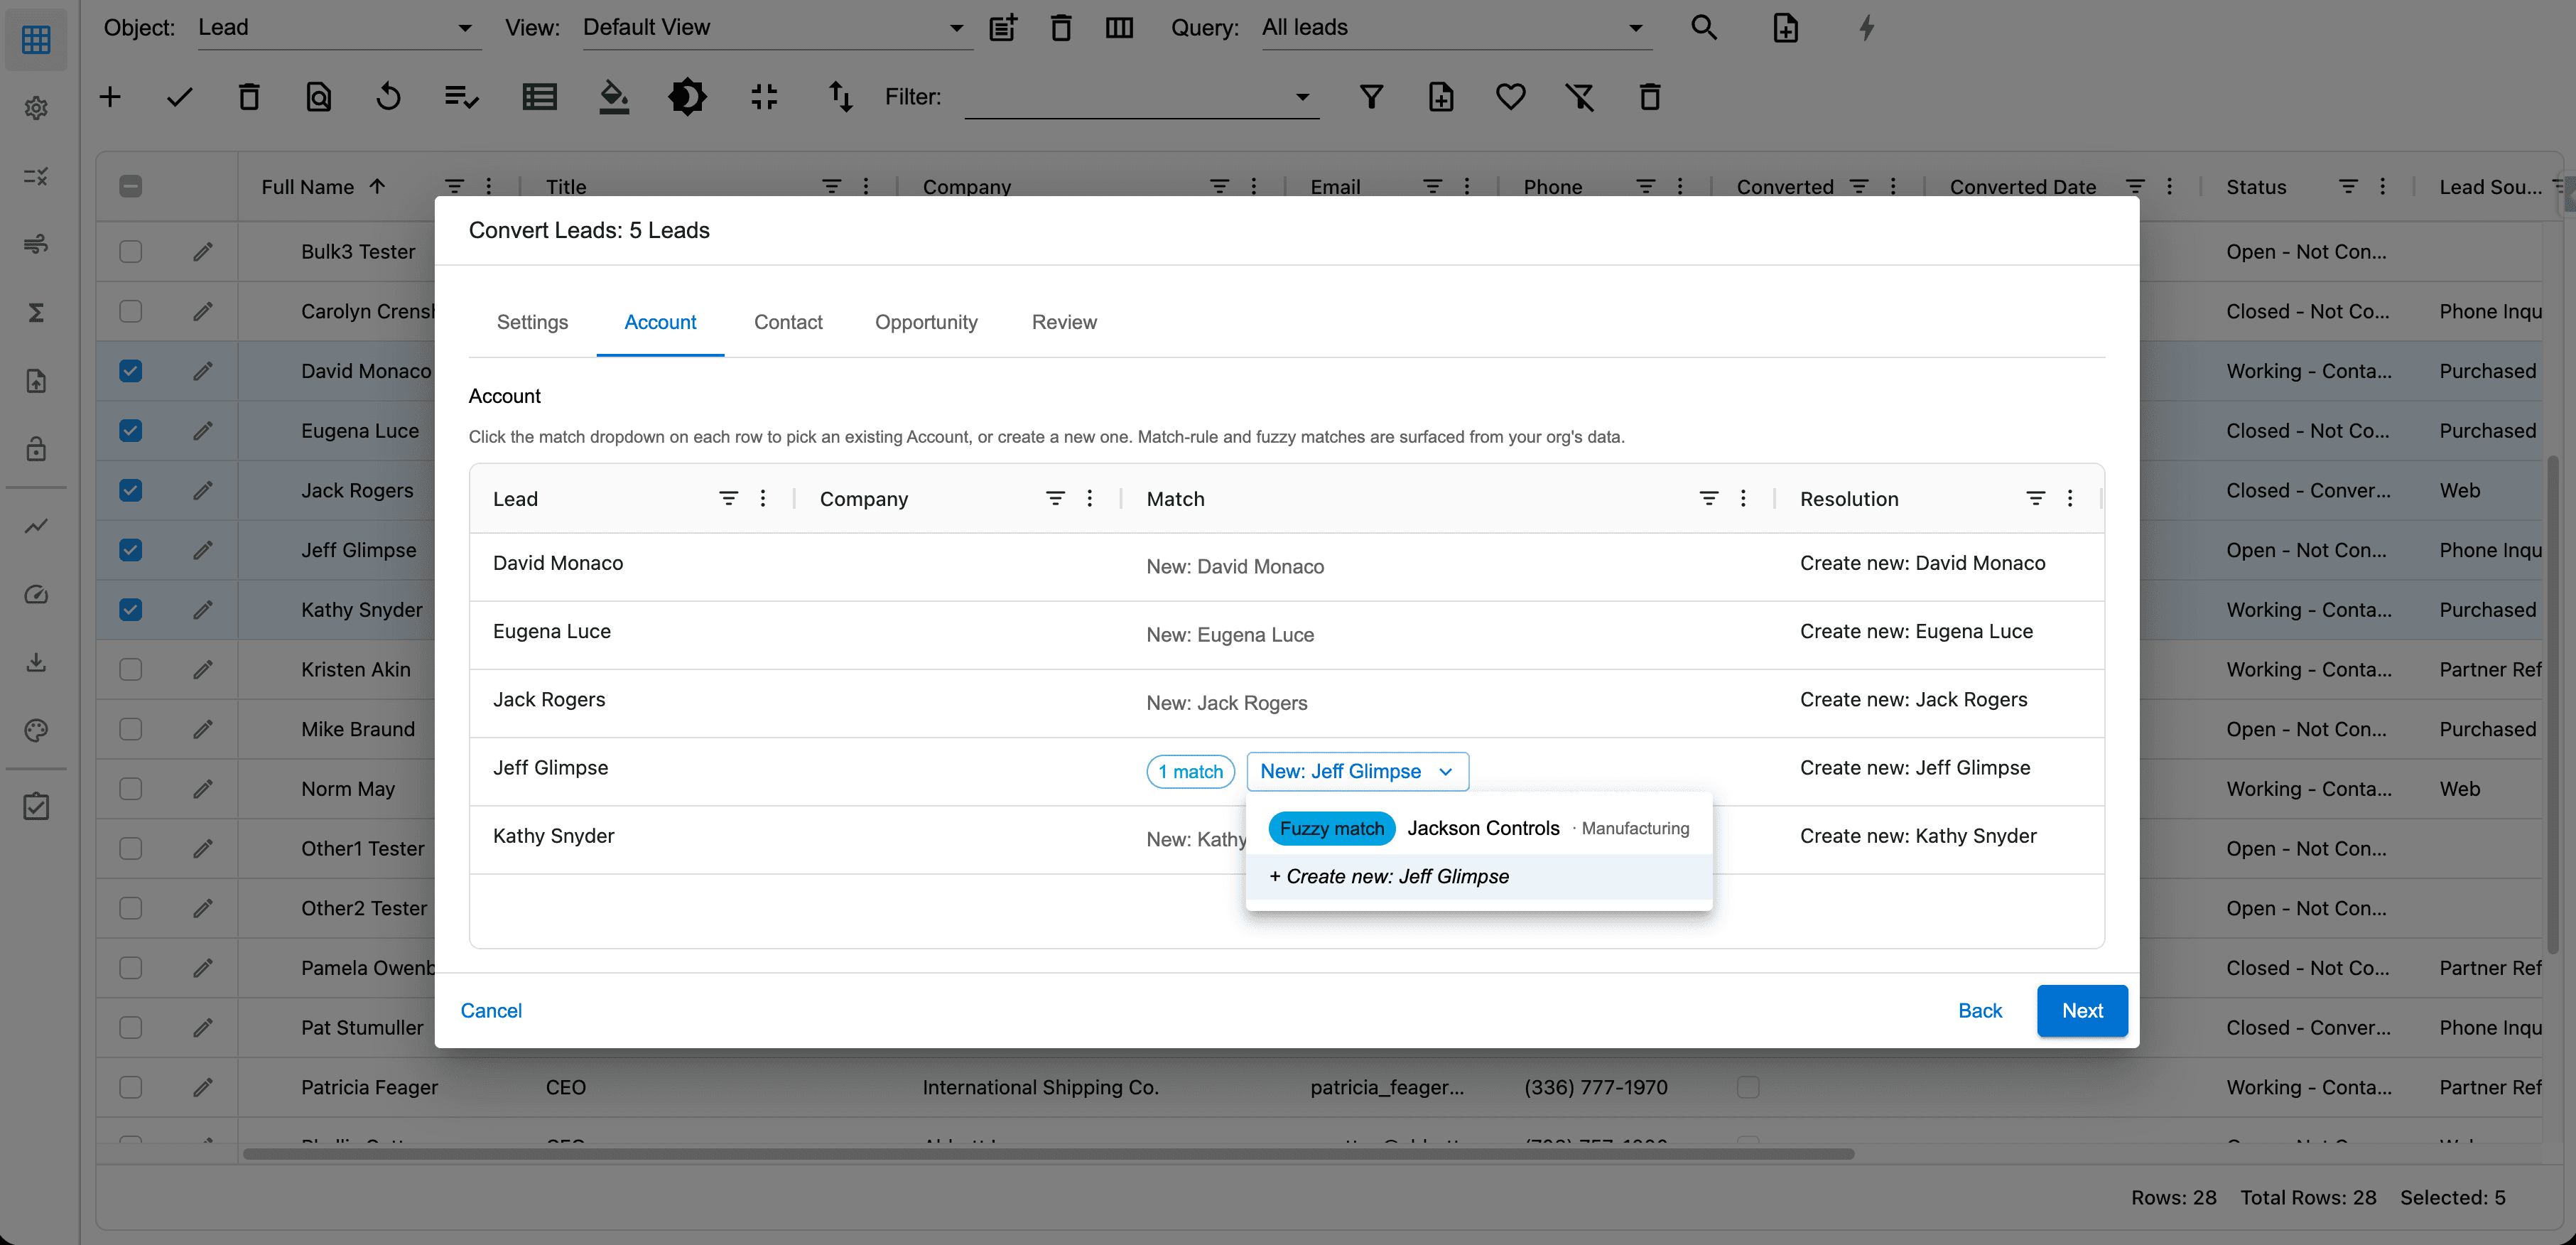
The second page will perform a fuzzy match on the lead company name value against the current Accounts. If a match is found, you can choose the matched Account or create a new Account. Click the Next button.
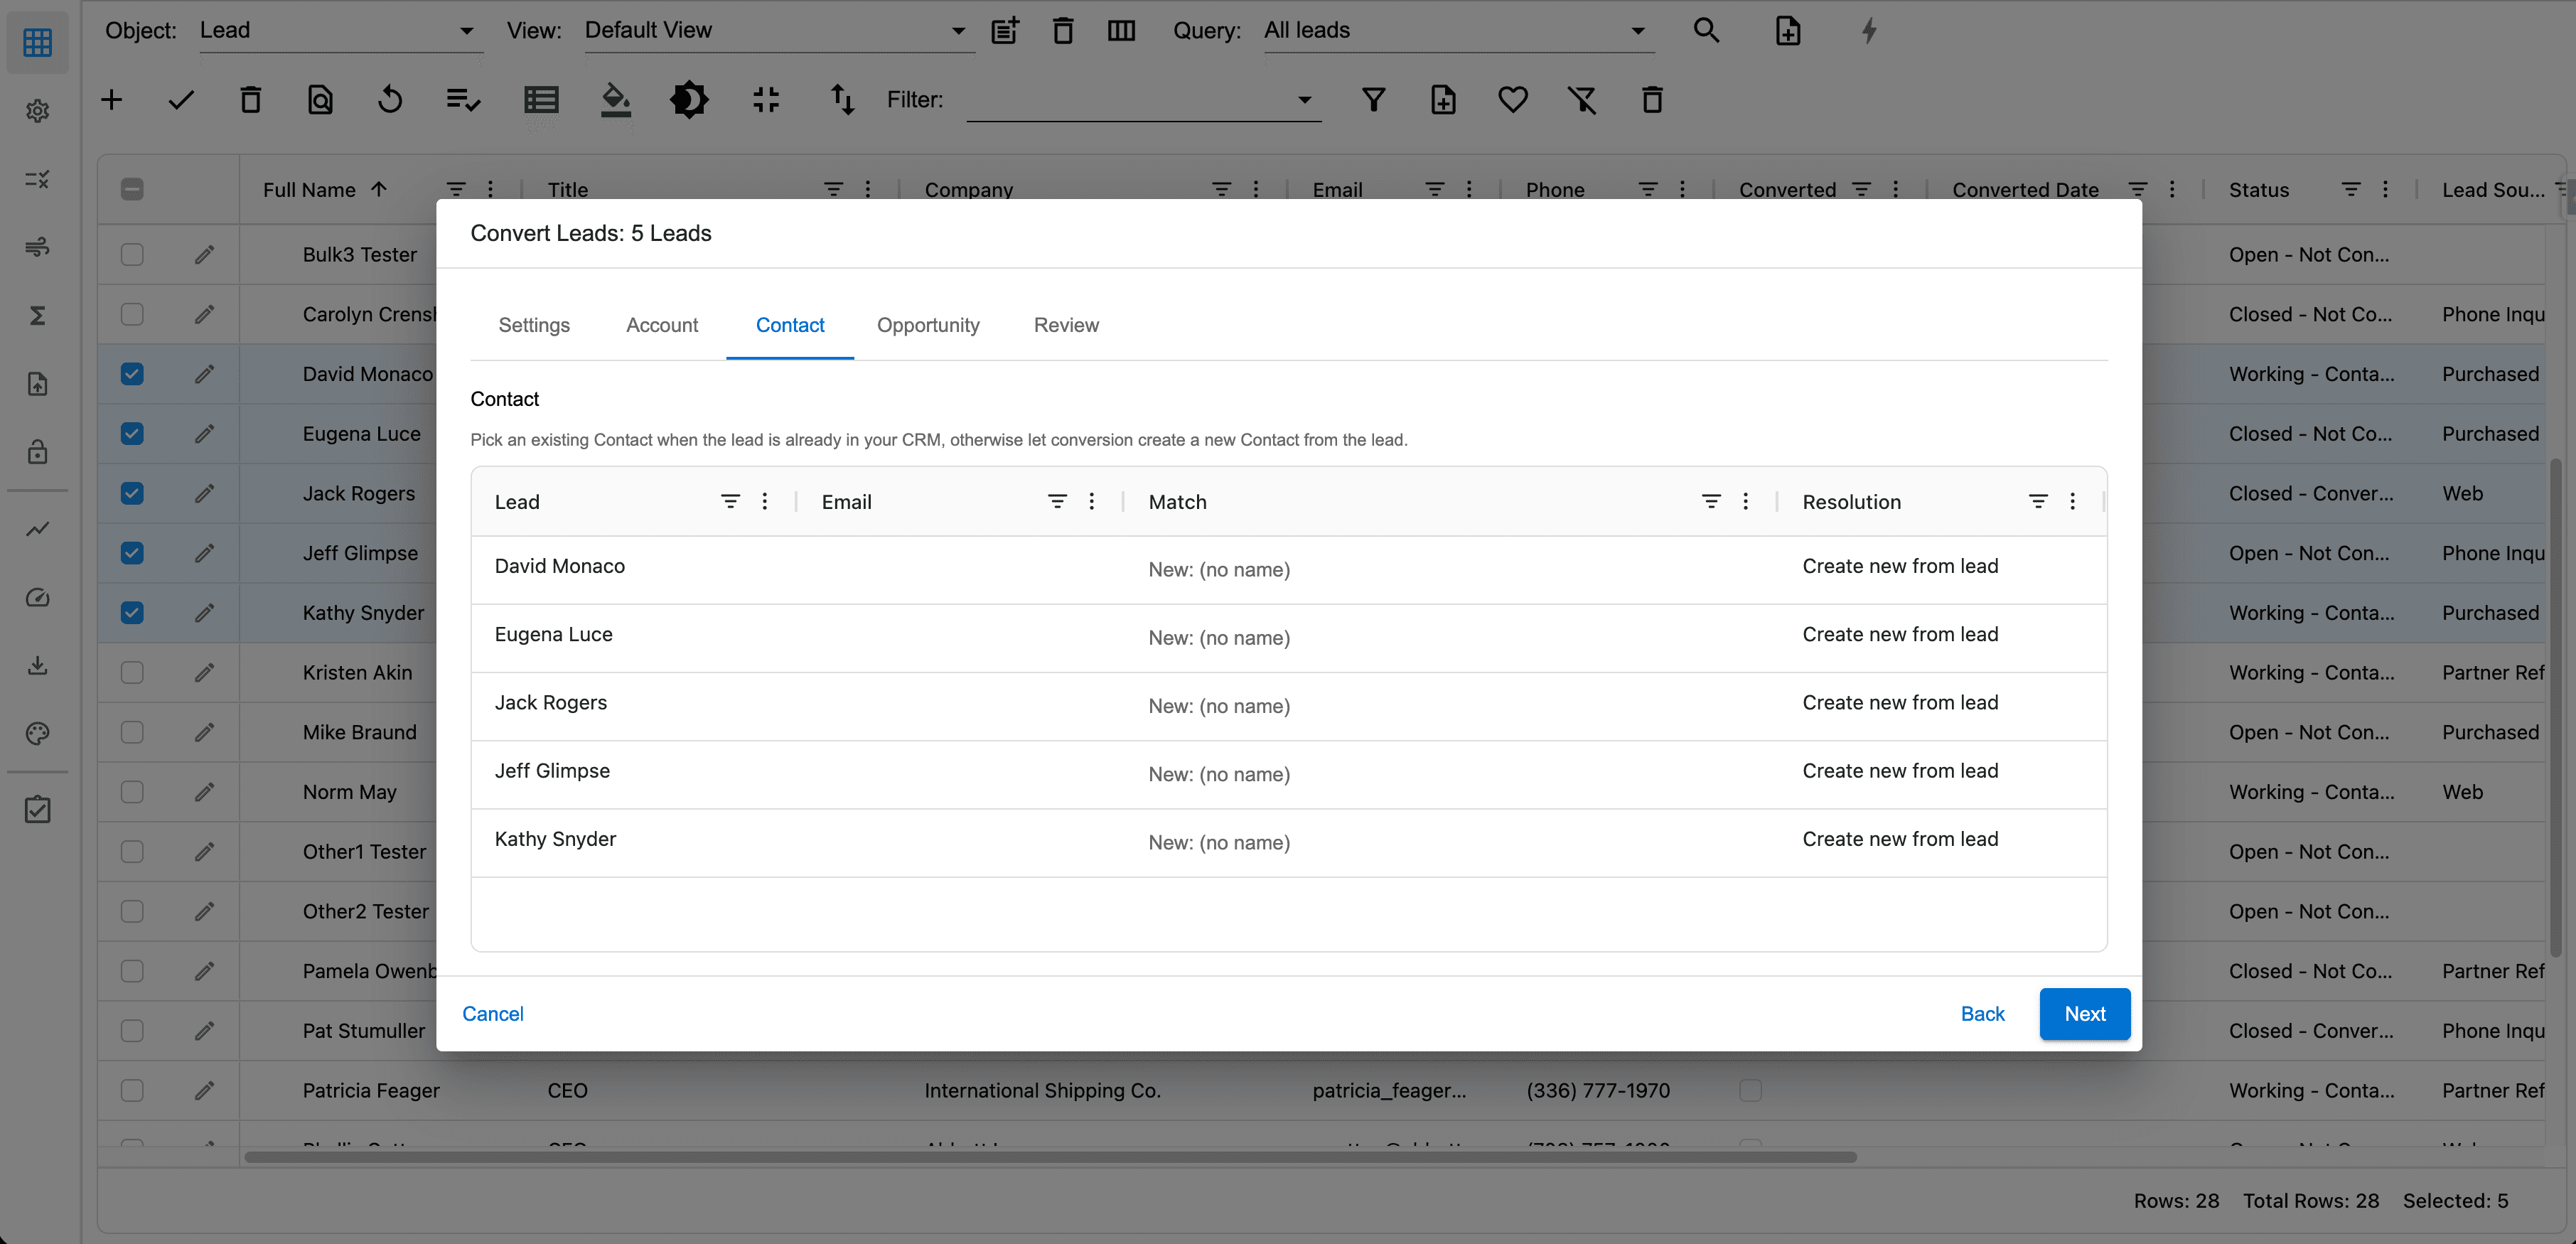
The third page will perform a fuzzy match on the lead contact name value against the current Contacts. If a match is found, you can choose the matched Contact or create a new Contact. Click the Next button.
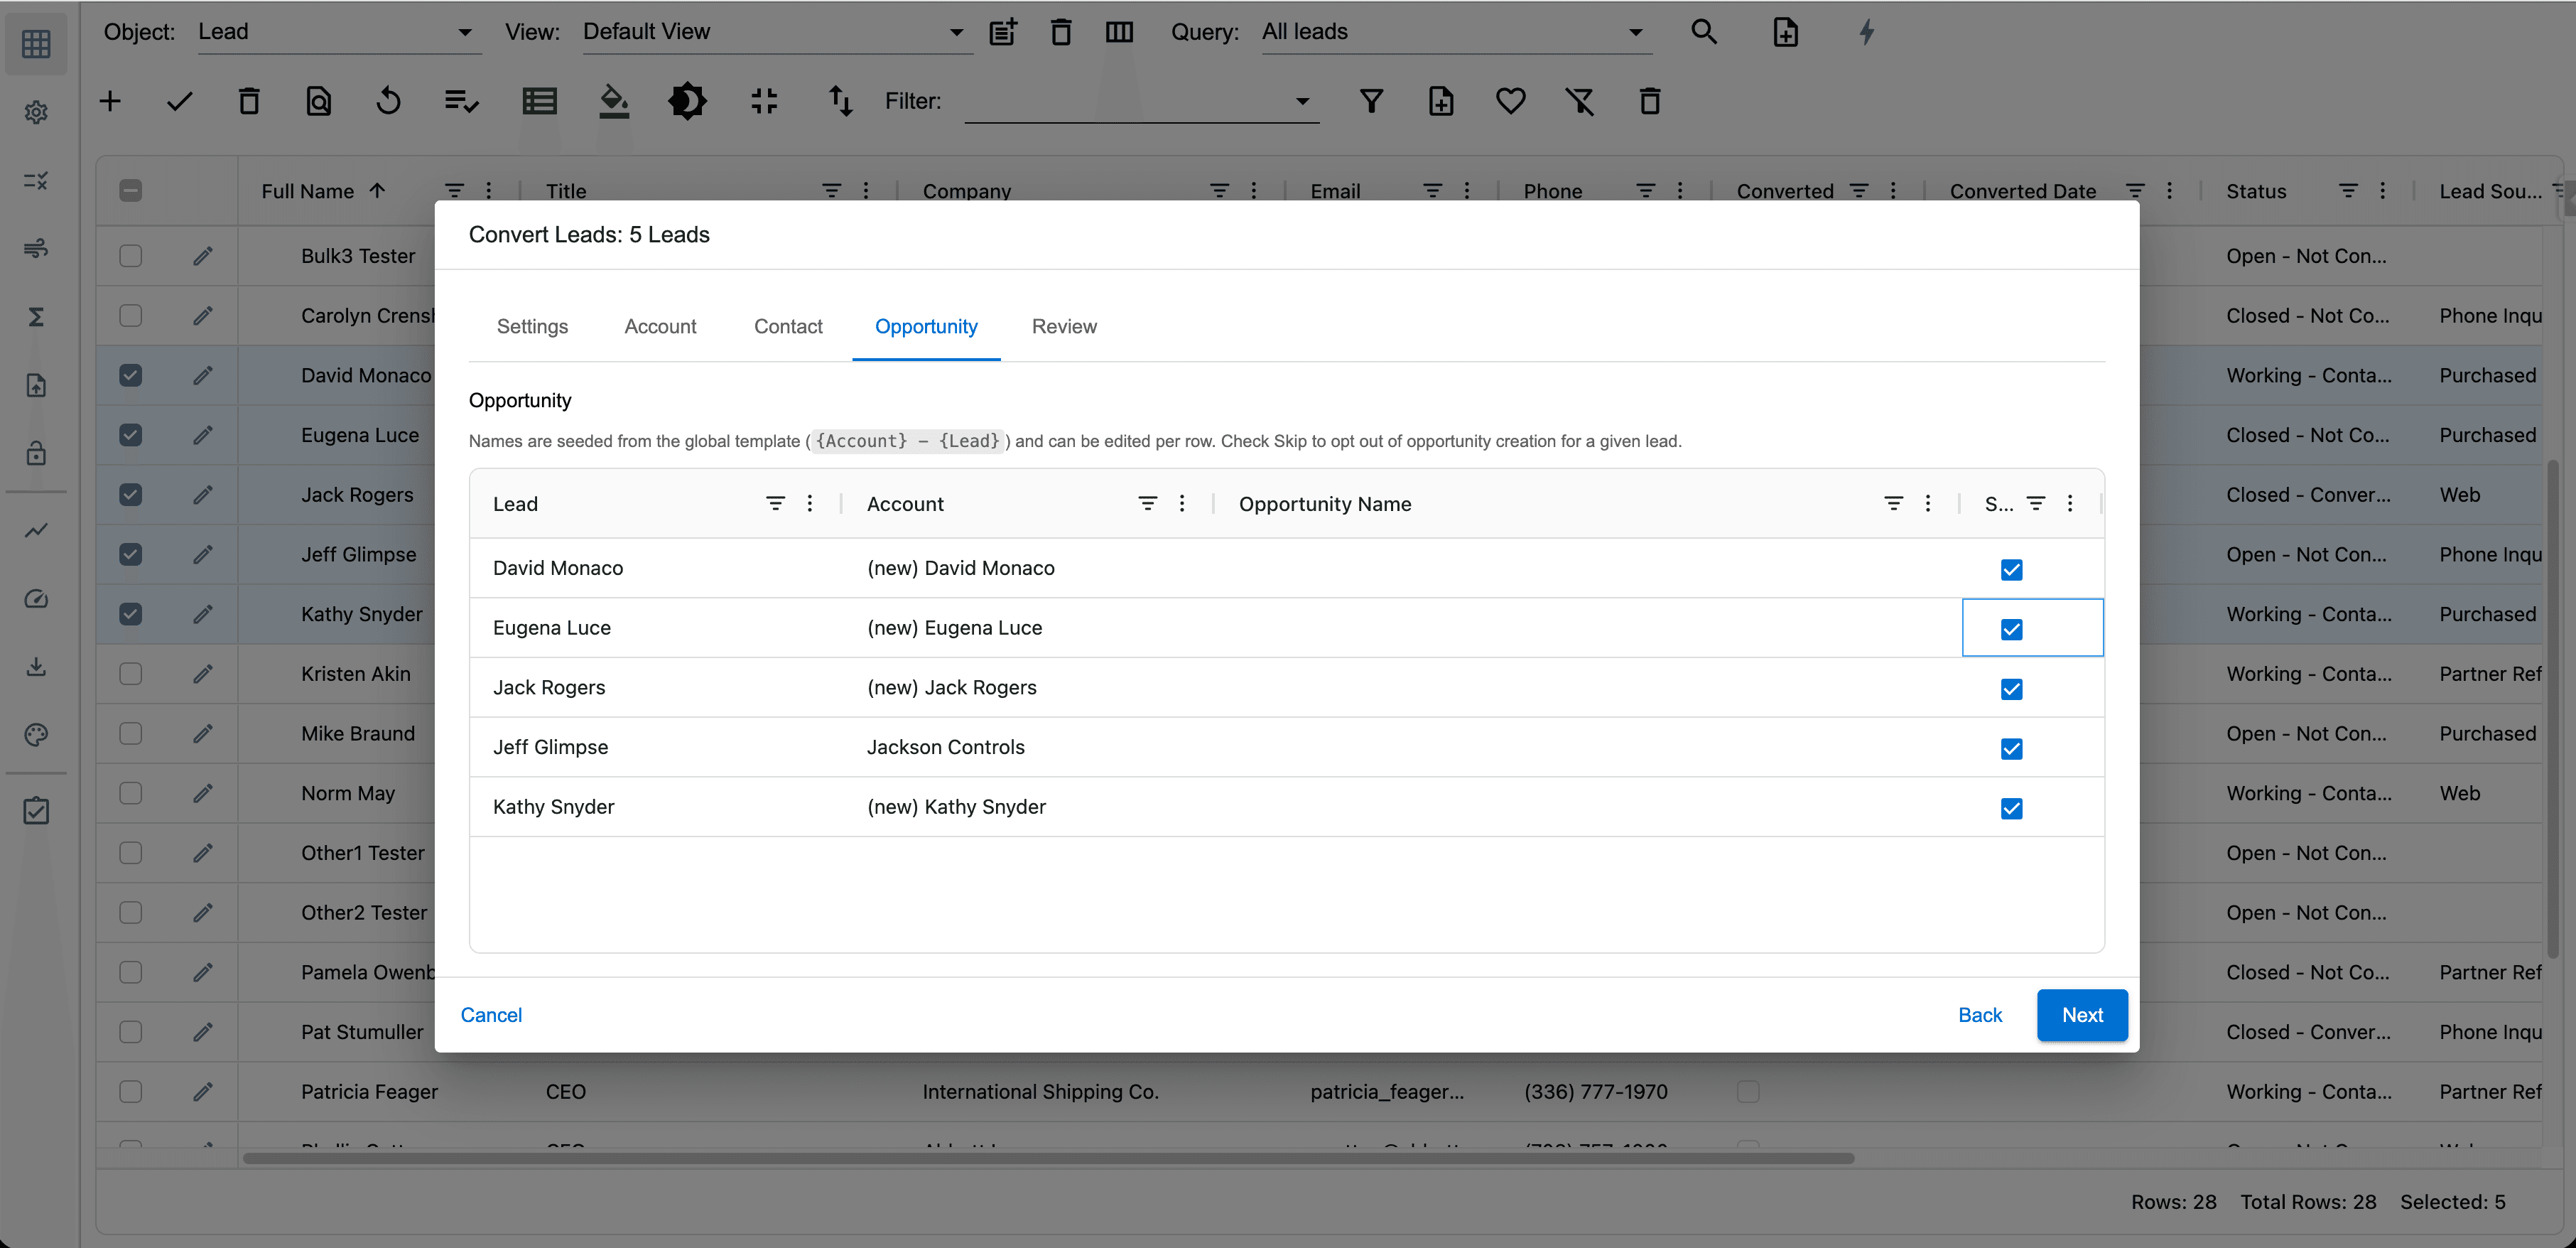
The forth page will perform a fuzzy match on the lead company name value against the current Opportunities. If a match is found, you can choose the matched Opportunity or create a new Opportunity. Click the Next button.
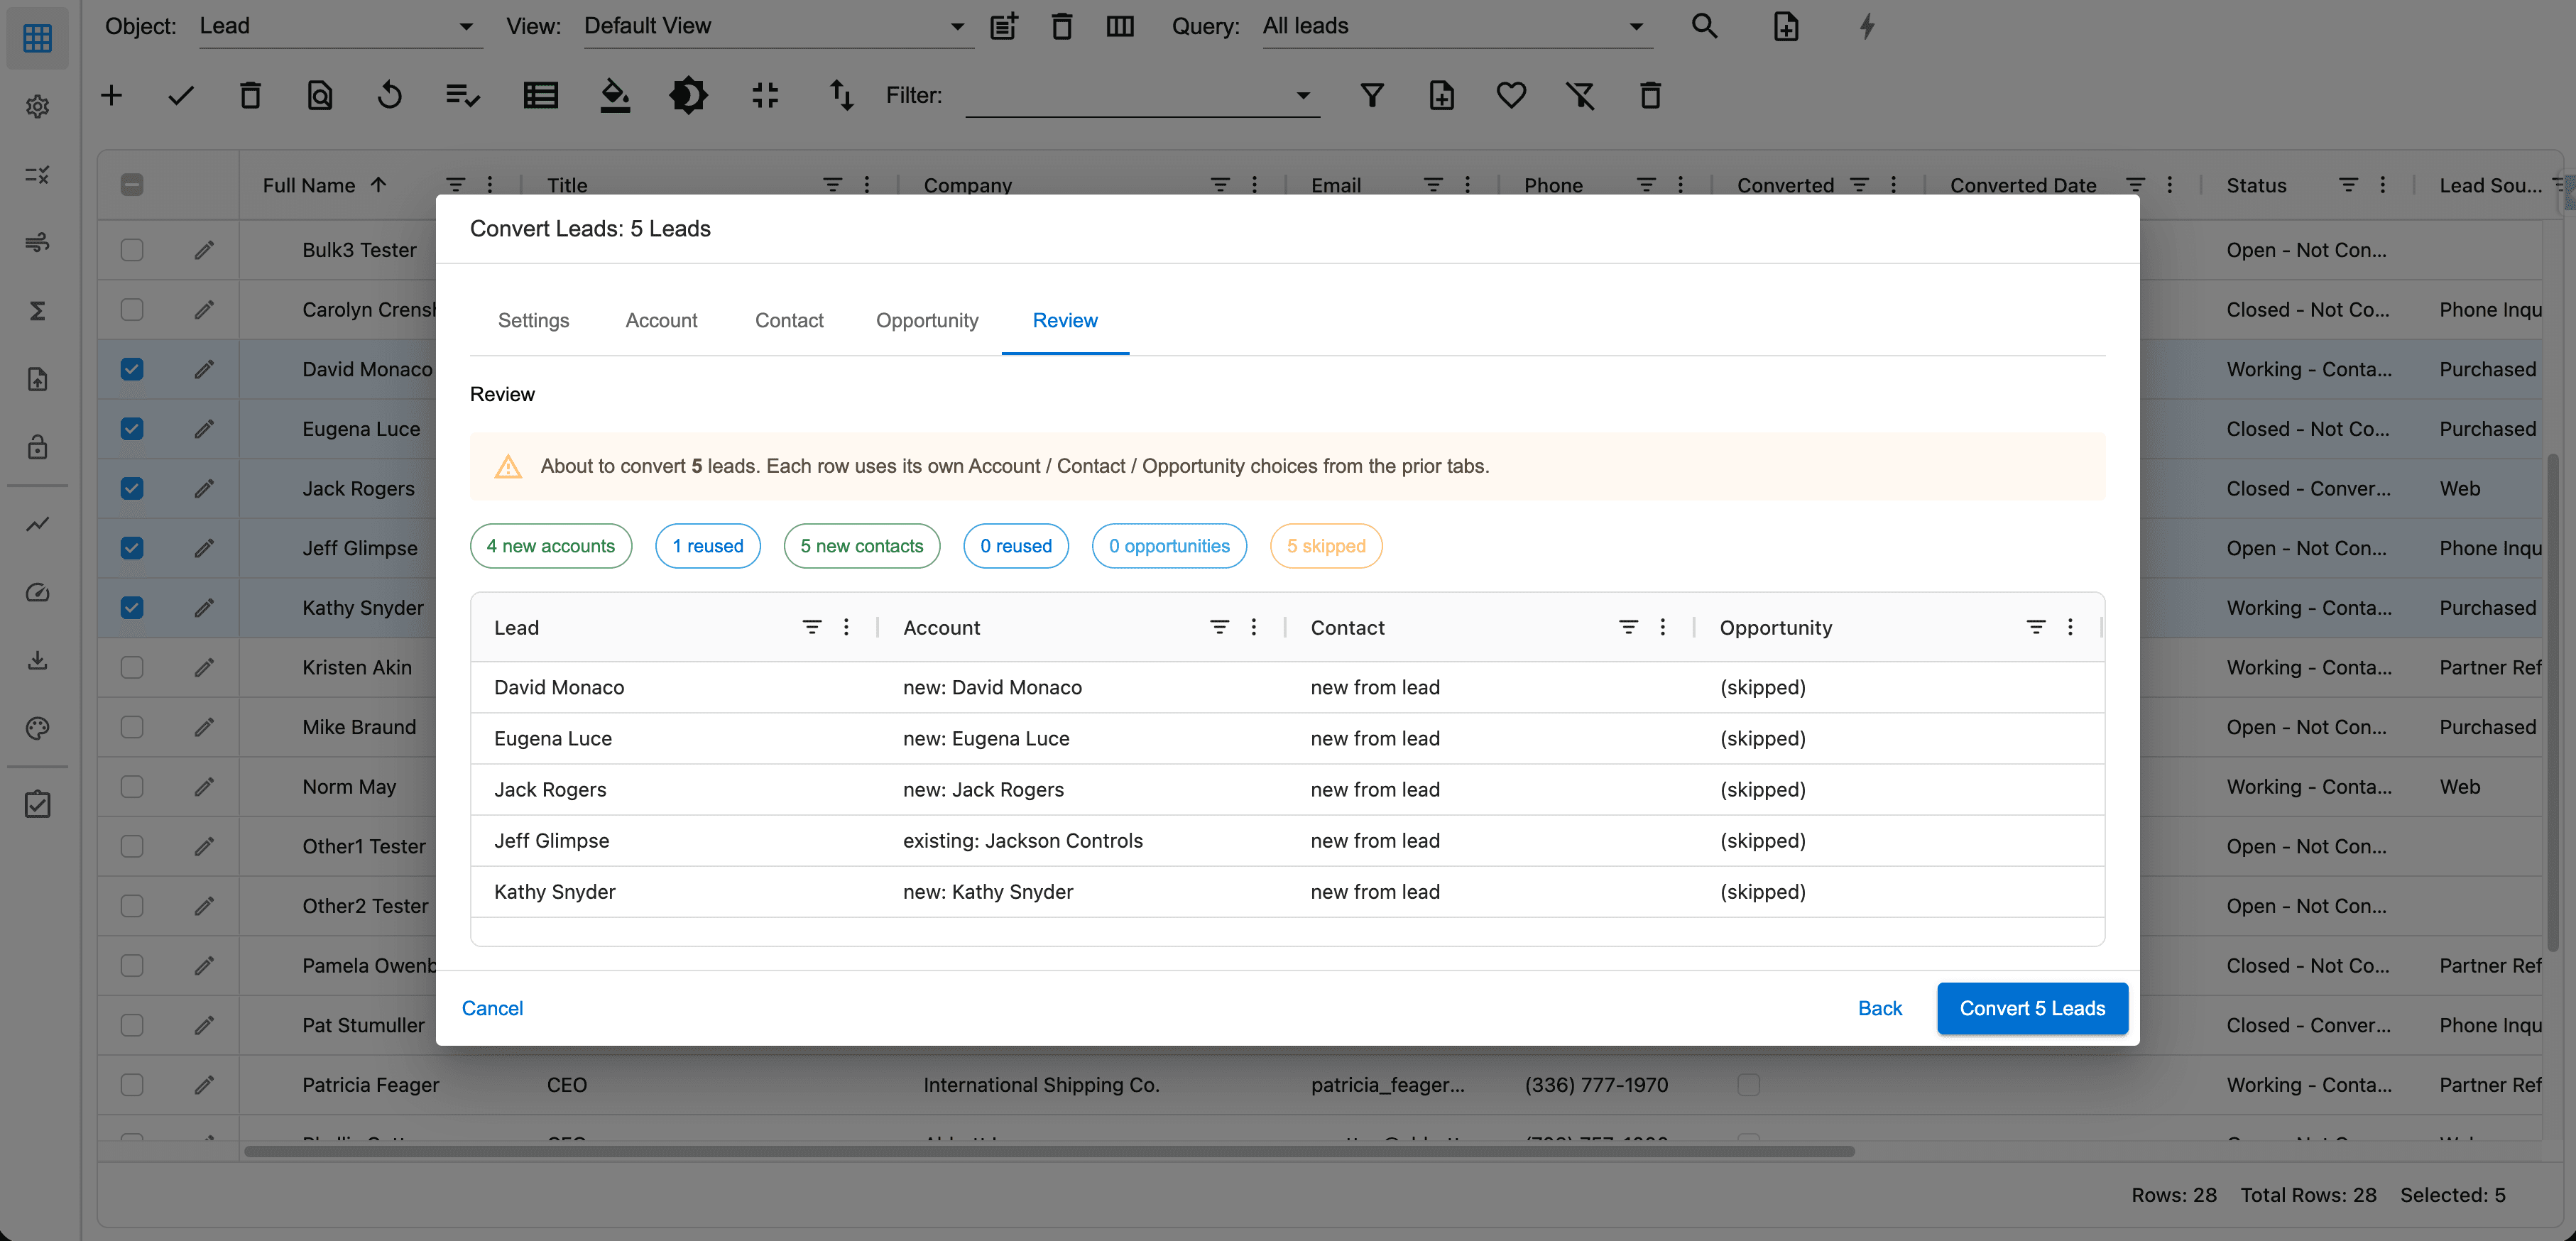
The fifth page will display a summary of the records that will be created. Click the Next button to execute the conversion. A success notification will be displayed when completed.
Add to campaign
The AppGrid Add To Campaign wizard allows users to right-click any Lead or Contact selection in AppGrid and add those records to a Salesforce Campaign in one step.
For a single record, the dialog offers a smart Campaign search that suggests recently-active campaigns as you type, automatically loads the right Member Status options once a Campaign is picked, and shows a clear notice if the record is already a campaign member — with a one-click option to update their status instead.
For bulk selections, the same simple form applies to the whole list, with the work automatically broken into manageable batches behind the scenes. When the dialog finishes, users see a complete report: how many records were added, how many were updated, and exactly which ones were skipped and why — with separate sections for "already a member," "already converted leads," "no access," and other reasons.
Failures can be downloaded as a CSV for follow-up, and a built-in retry view lets users re-run just the records that hit a recoverable error, without having to re-select the original list.
Compared to the standard Salesforce experience, AppGrid's version is far more practical for real-world marketing and sales operations work. The native Add to Campaign button is limited to 200 records at a time and gives almost no feedback — you click, see a brief "added X members" message, and have no easy way to find out which records didn't make it.
AppGrid removes the size limit (any selection works), tells you exactly what happened to every record, distinguishes between adding new members and updating existing ones with a clear checkbox, exports any failures so you can fix them offline, and lets users retry recoverable issues with a single click.
For a marketing operations manager pulling leads from a filtered view to drop into a webinar campaign, what would normally take multiple rounds of splitting the list, clicking, checking results, and re-doing the failures becomes a single guided dialog with a complete record of what got done.
You can choose what actions are performed when the record owner is changed. Click the Save button to execute the ownership change. A summary is provided after the operation is performed and the query is refreshed.
Drag edit fill
AppGrid provides the ability to edit column values by using the drag fill feature (similar to Excel). Select a cell and using the drag icon in the lower right of the cell, drag the icon to another cell. In the image below, we copied the AccountType value from the AAA Test record to the selected rows.
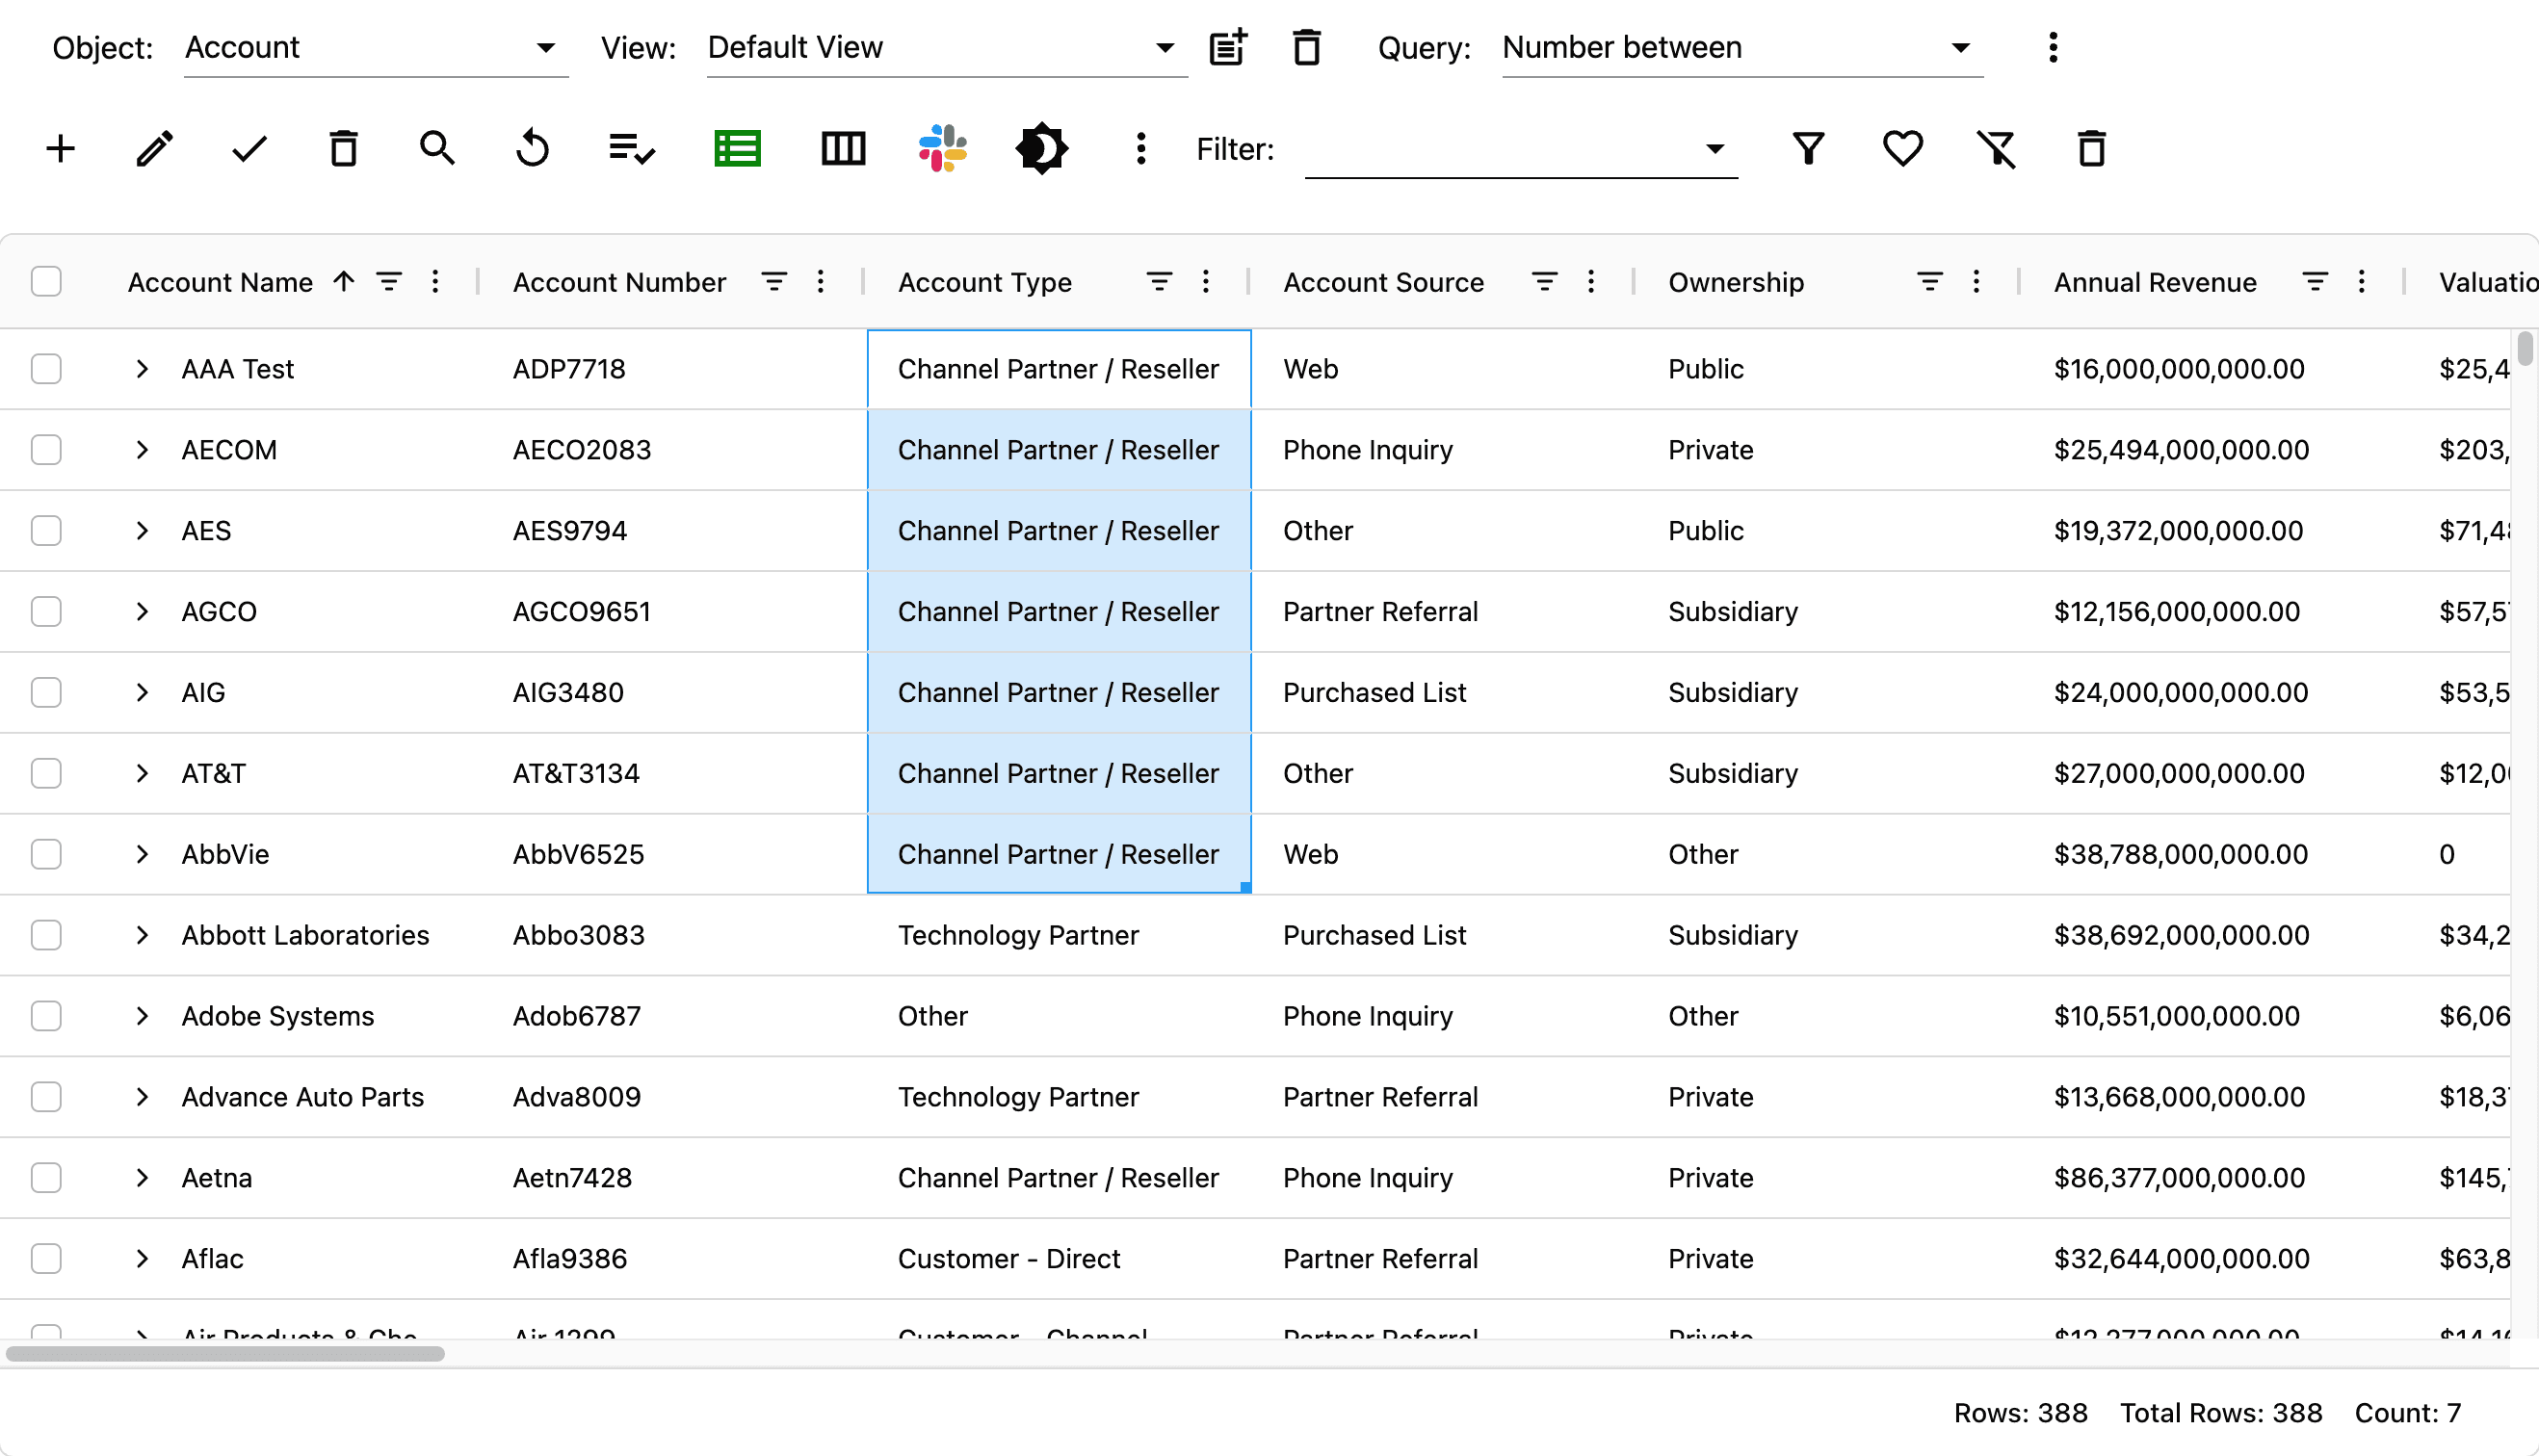
Mass editing
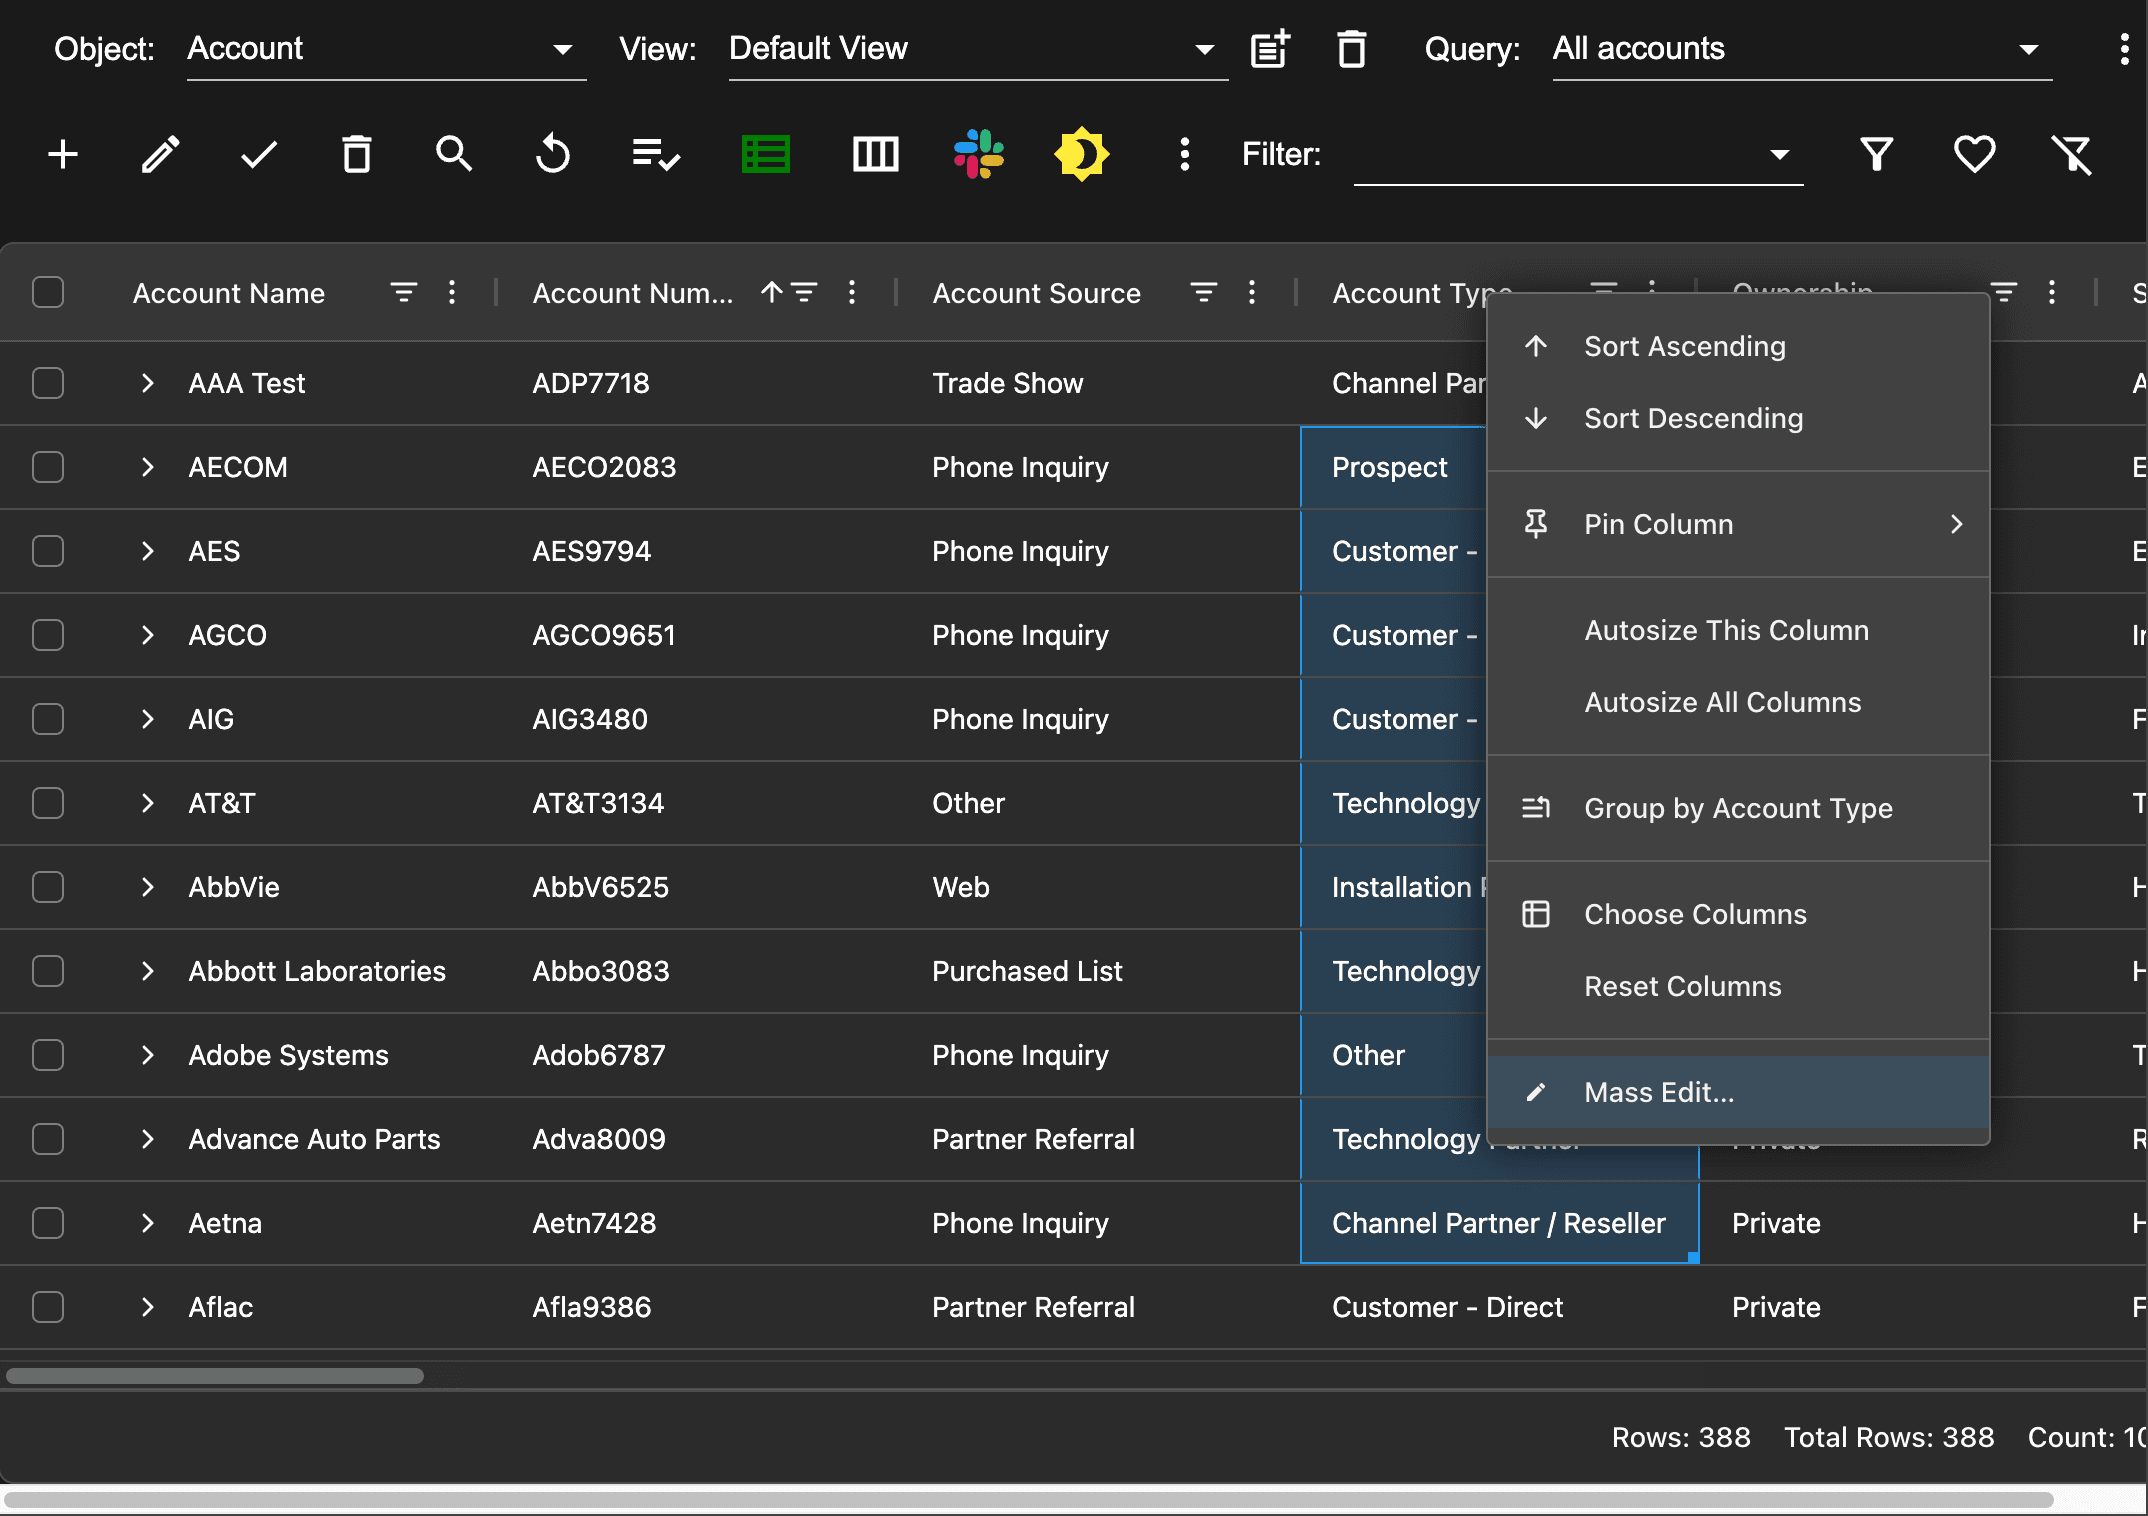
In addition to drag edit fill, AppGrid provides the ability to mass edit many records at once. Drag select some values in a column. Right-click on the column header and select Mass Edit. The mass edit dialog will open. Unlike the native Salesforce UI, there is no limit to the number of rows that can be updated.
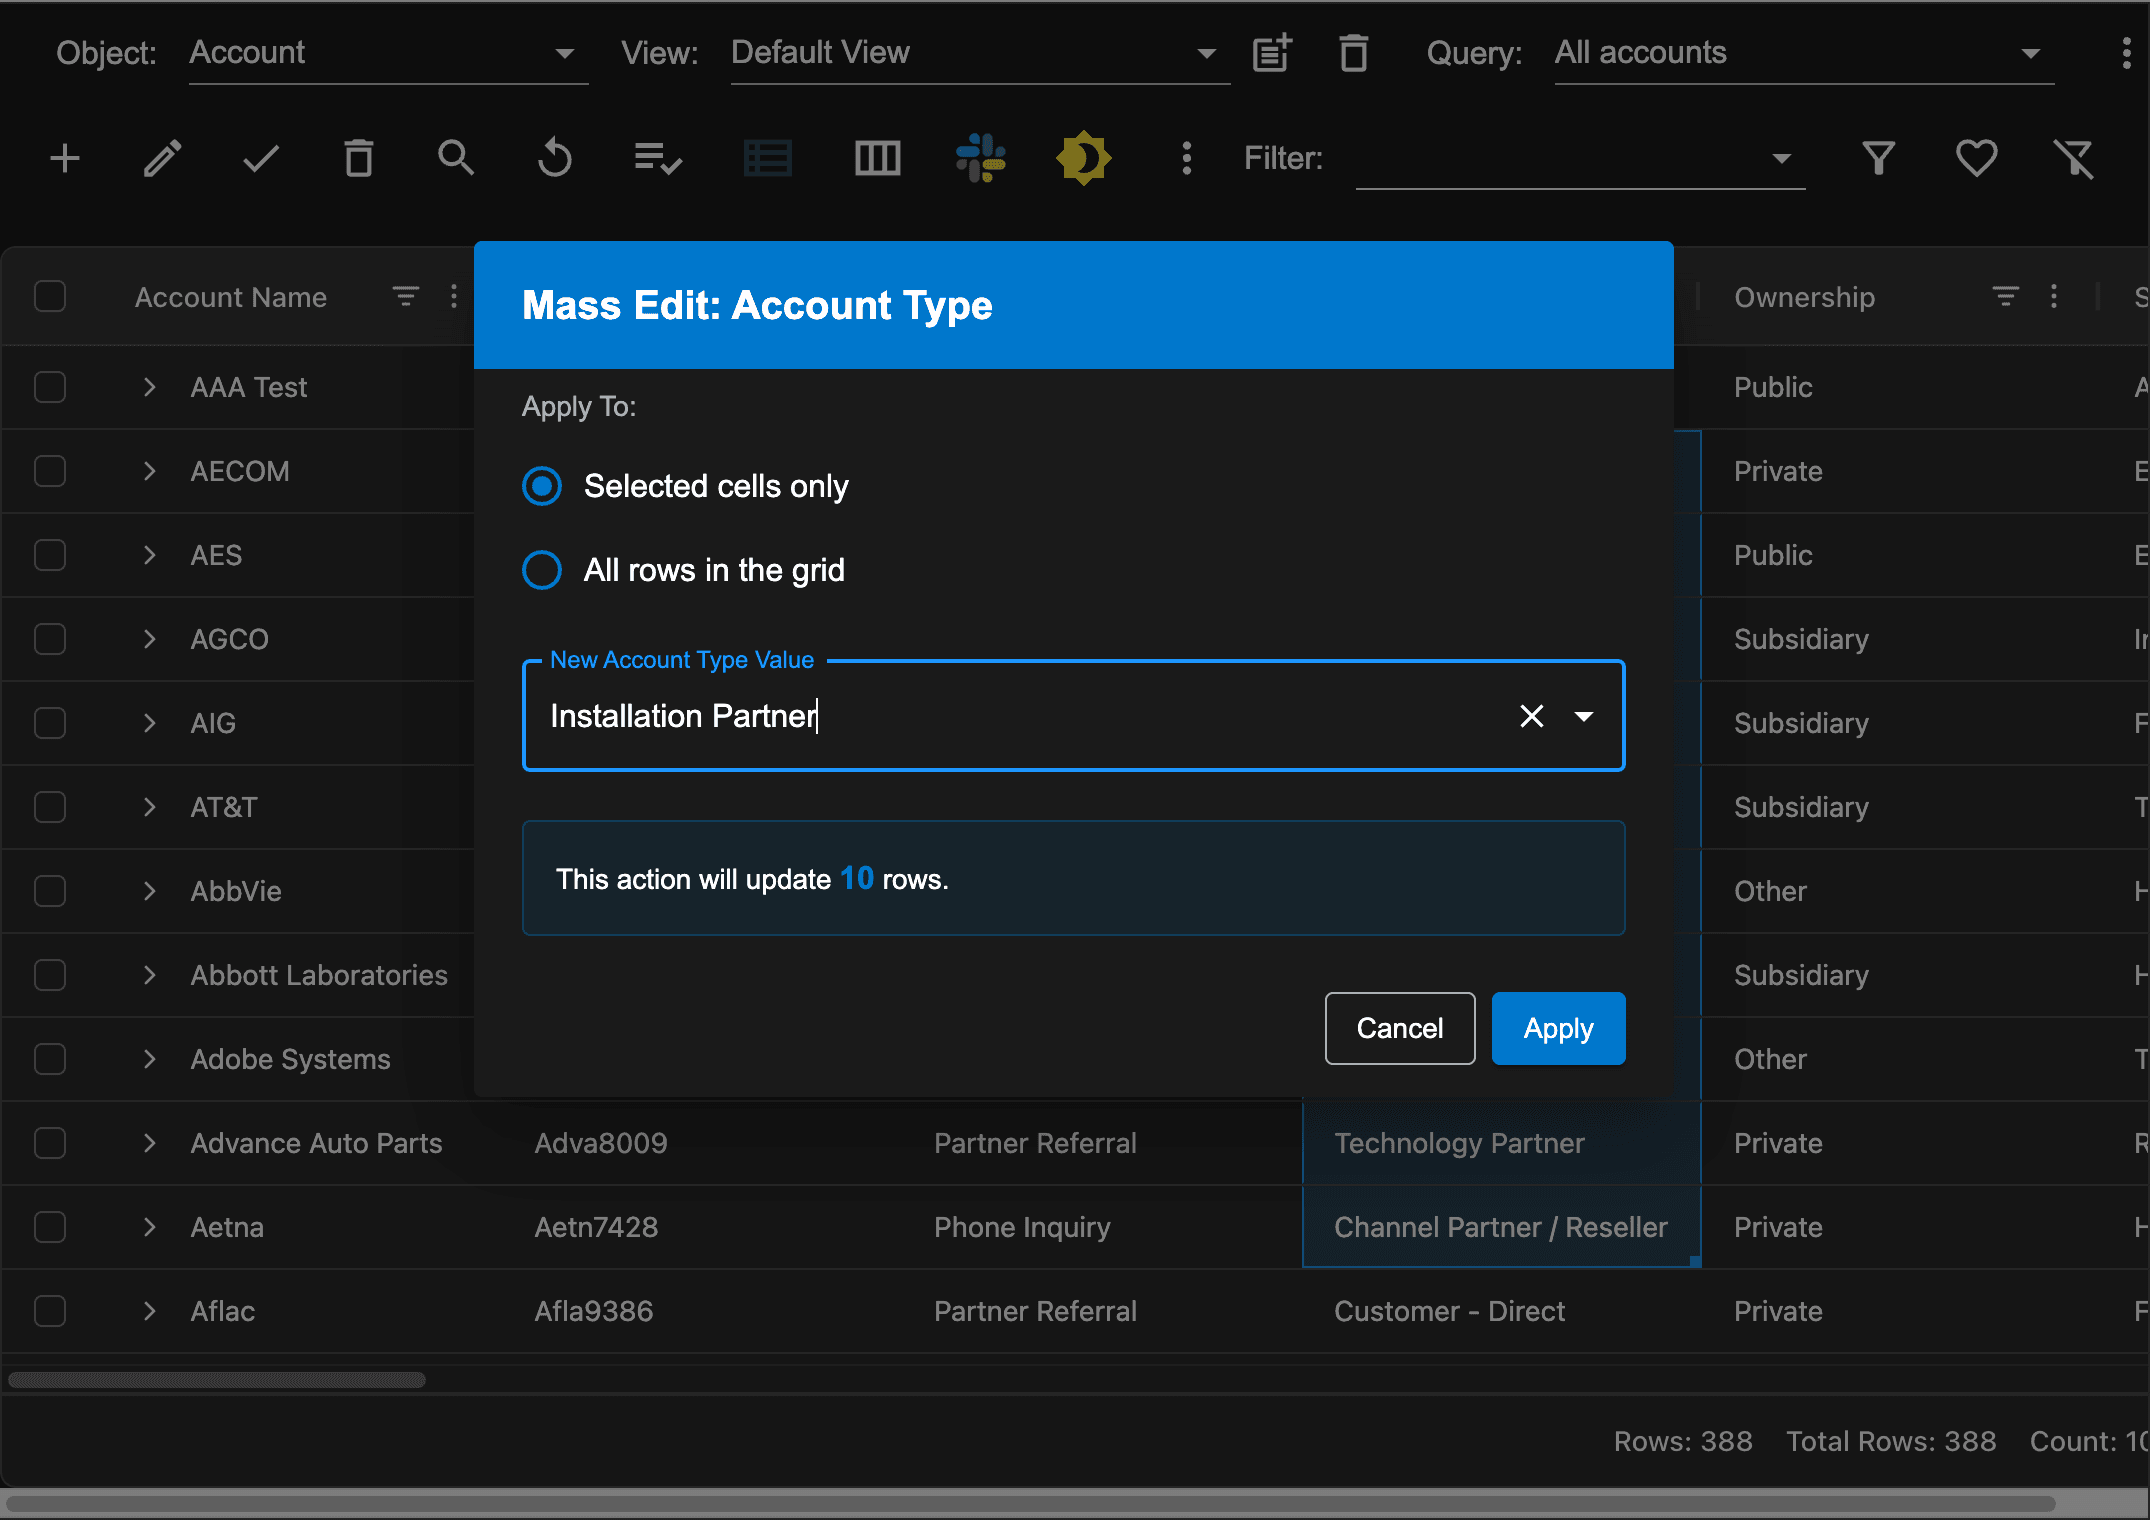
You can choose to mass edit the selected cell values or all row values in the grid. An editor will be displayed that is´appropriate for the column data type. Enter the value to be applied. A confirmation message is displayed indicating how many rows will be updated. Click the Apply button to mass edit the grid.
Drill up / drill down
The drill up / drill down feature can dramatically improve productivity of workflows that involve updating many records.
Using the native Salesforce UI limits you to working with one record's relationships at a time — click an Account, view its Contacts, take action, then repeat for the next Account.
AppGrid's Drill Up and Drill Down feature eliminates that bottleneck. Start with any filtered set of records, then navigate to their related parent or child records in a single step — giving you a flat, actionable grid of every related record across your entire result set. Combined with AppGrid's built-in Salesforce Flow integration, you can filter, navigate, and act without ever leaving the grid.
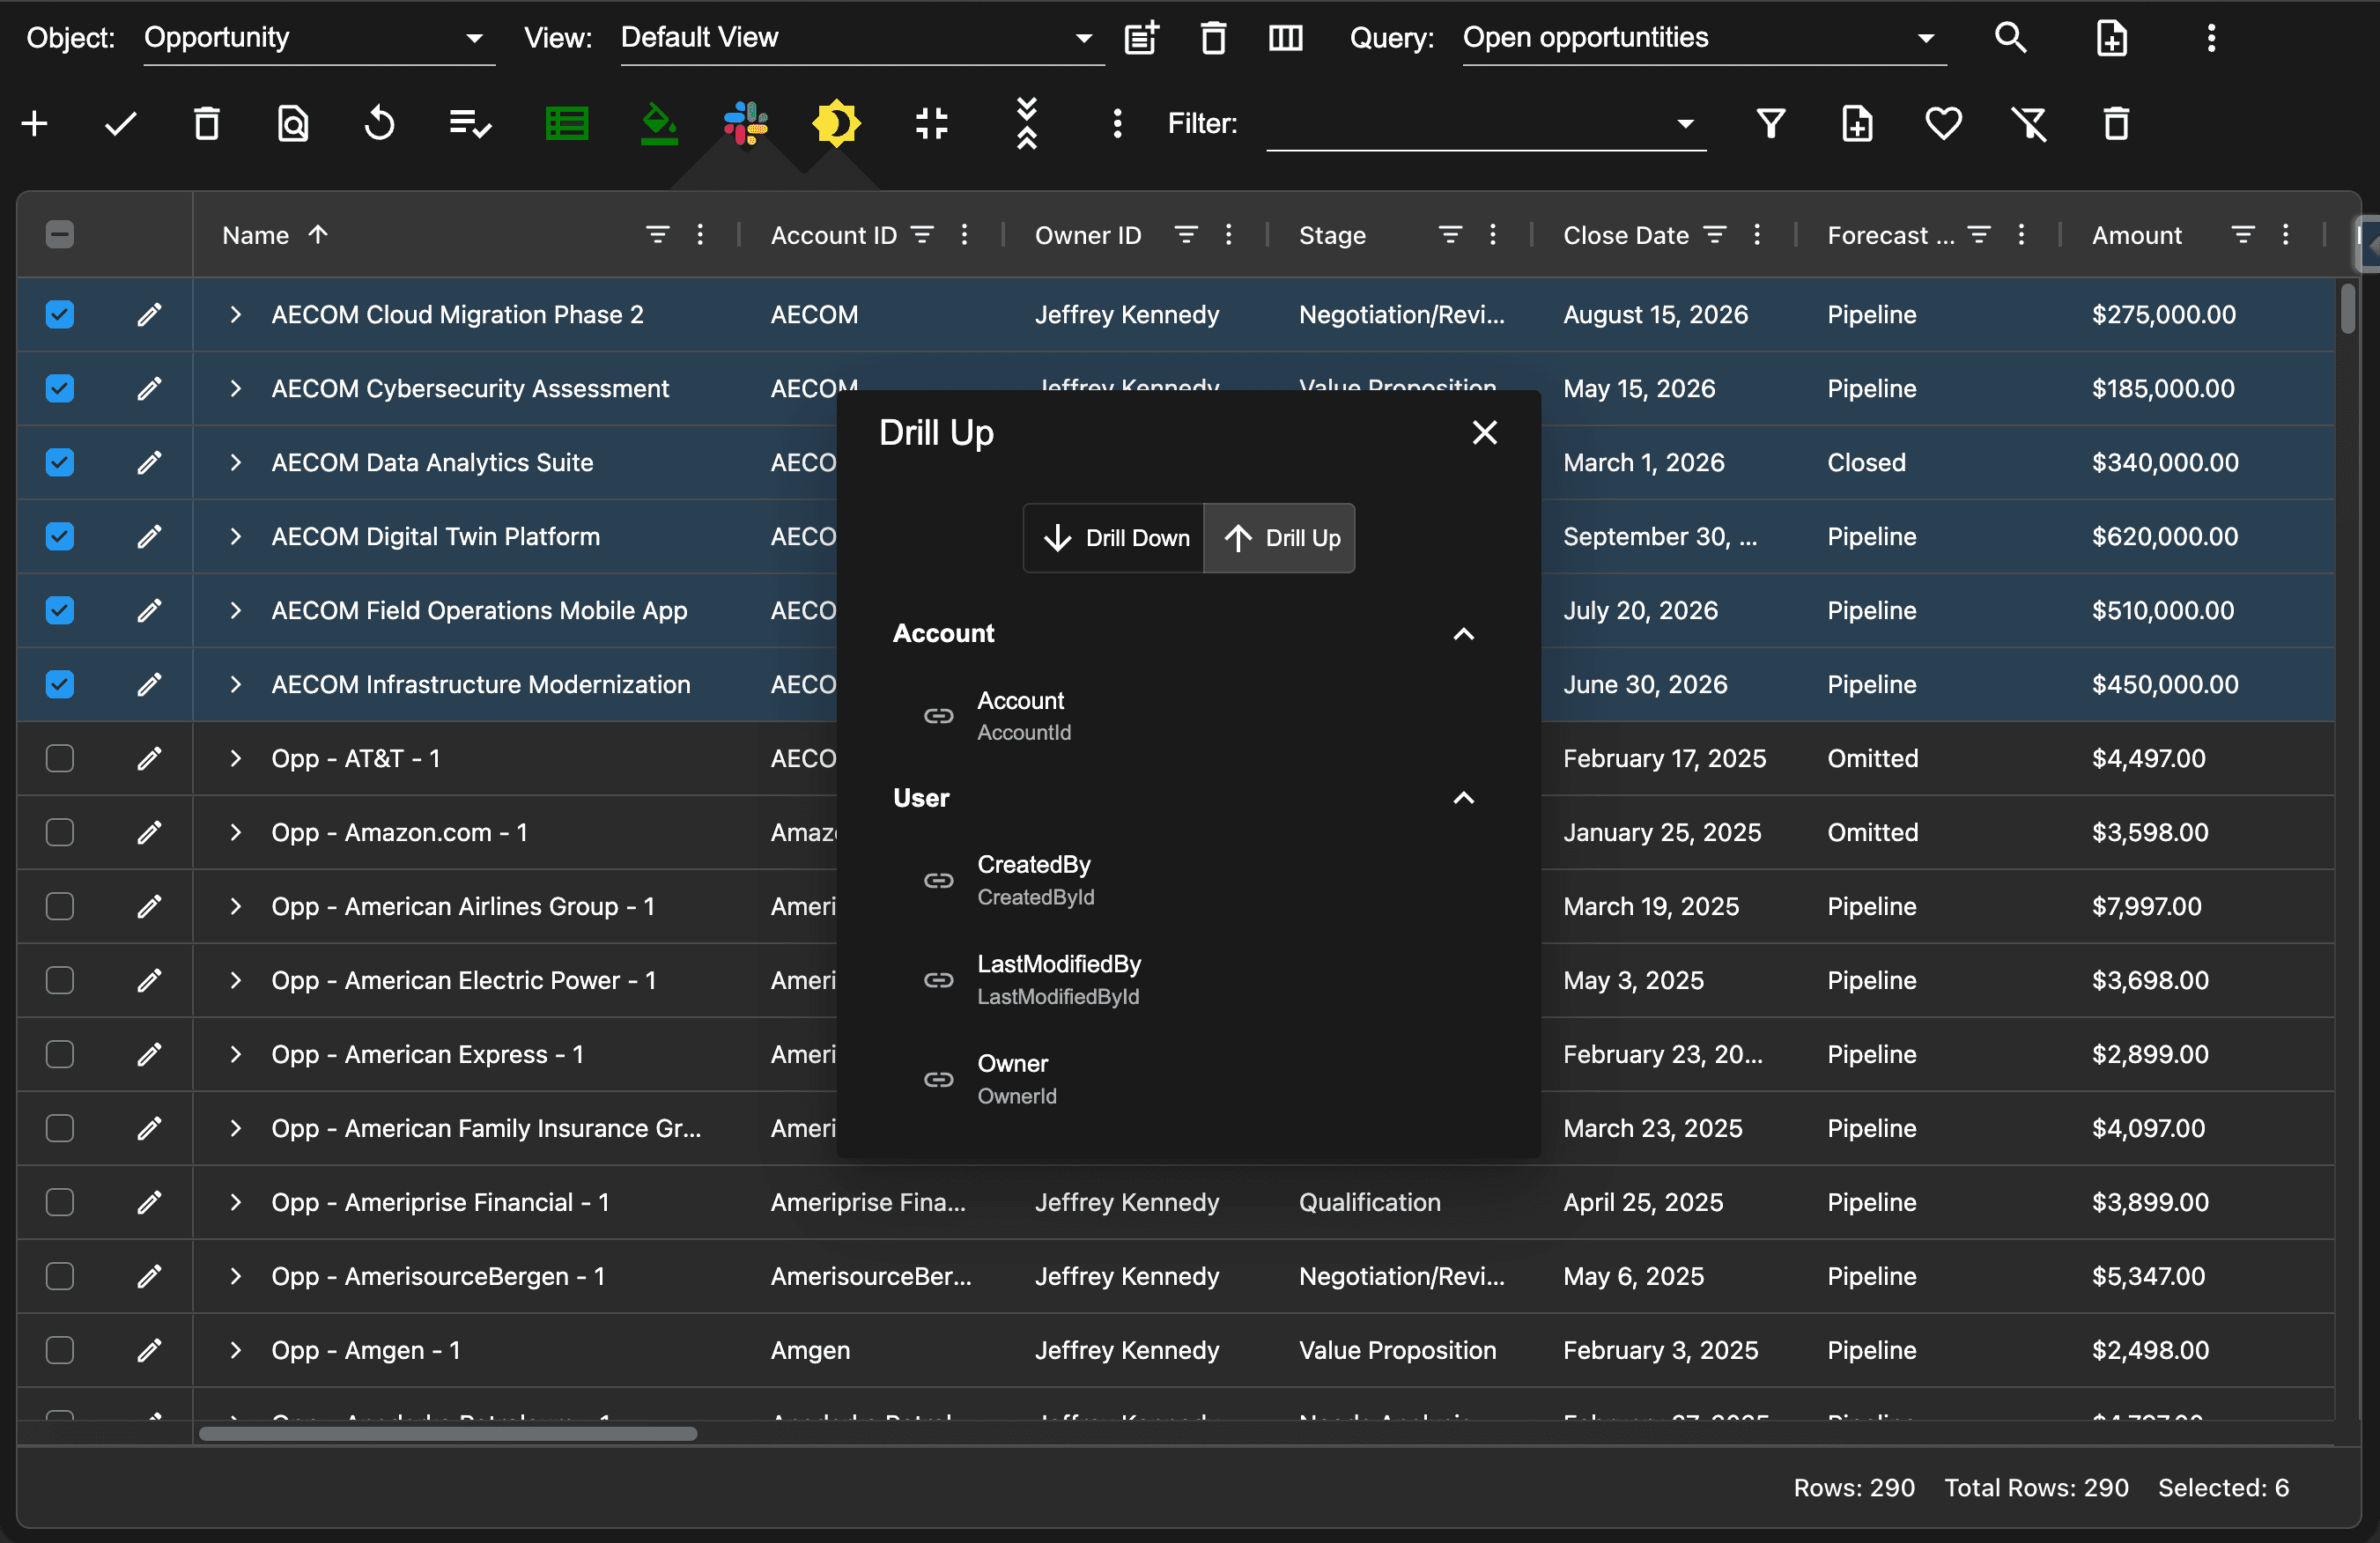
Click the drill up / drill down button in the toolbar to open the drill wizard dialog. Drill up to any parent relationship of the selected object. The objects shown in the drill up dialog are based on the users object preferences.
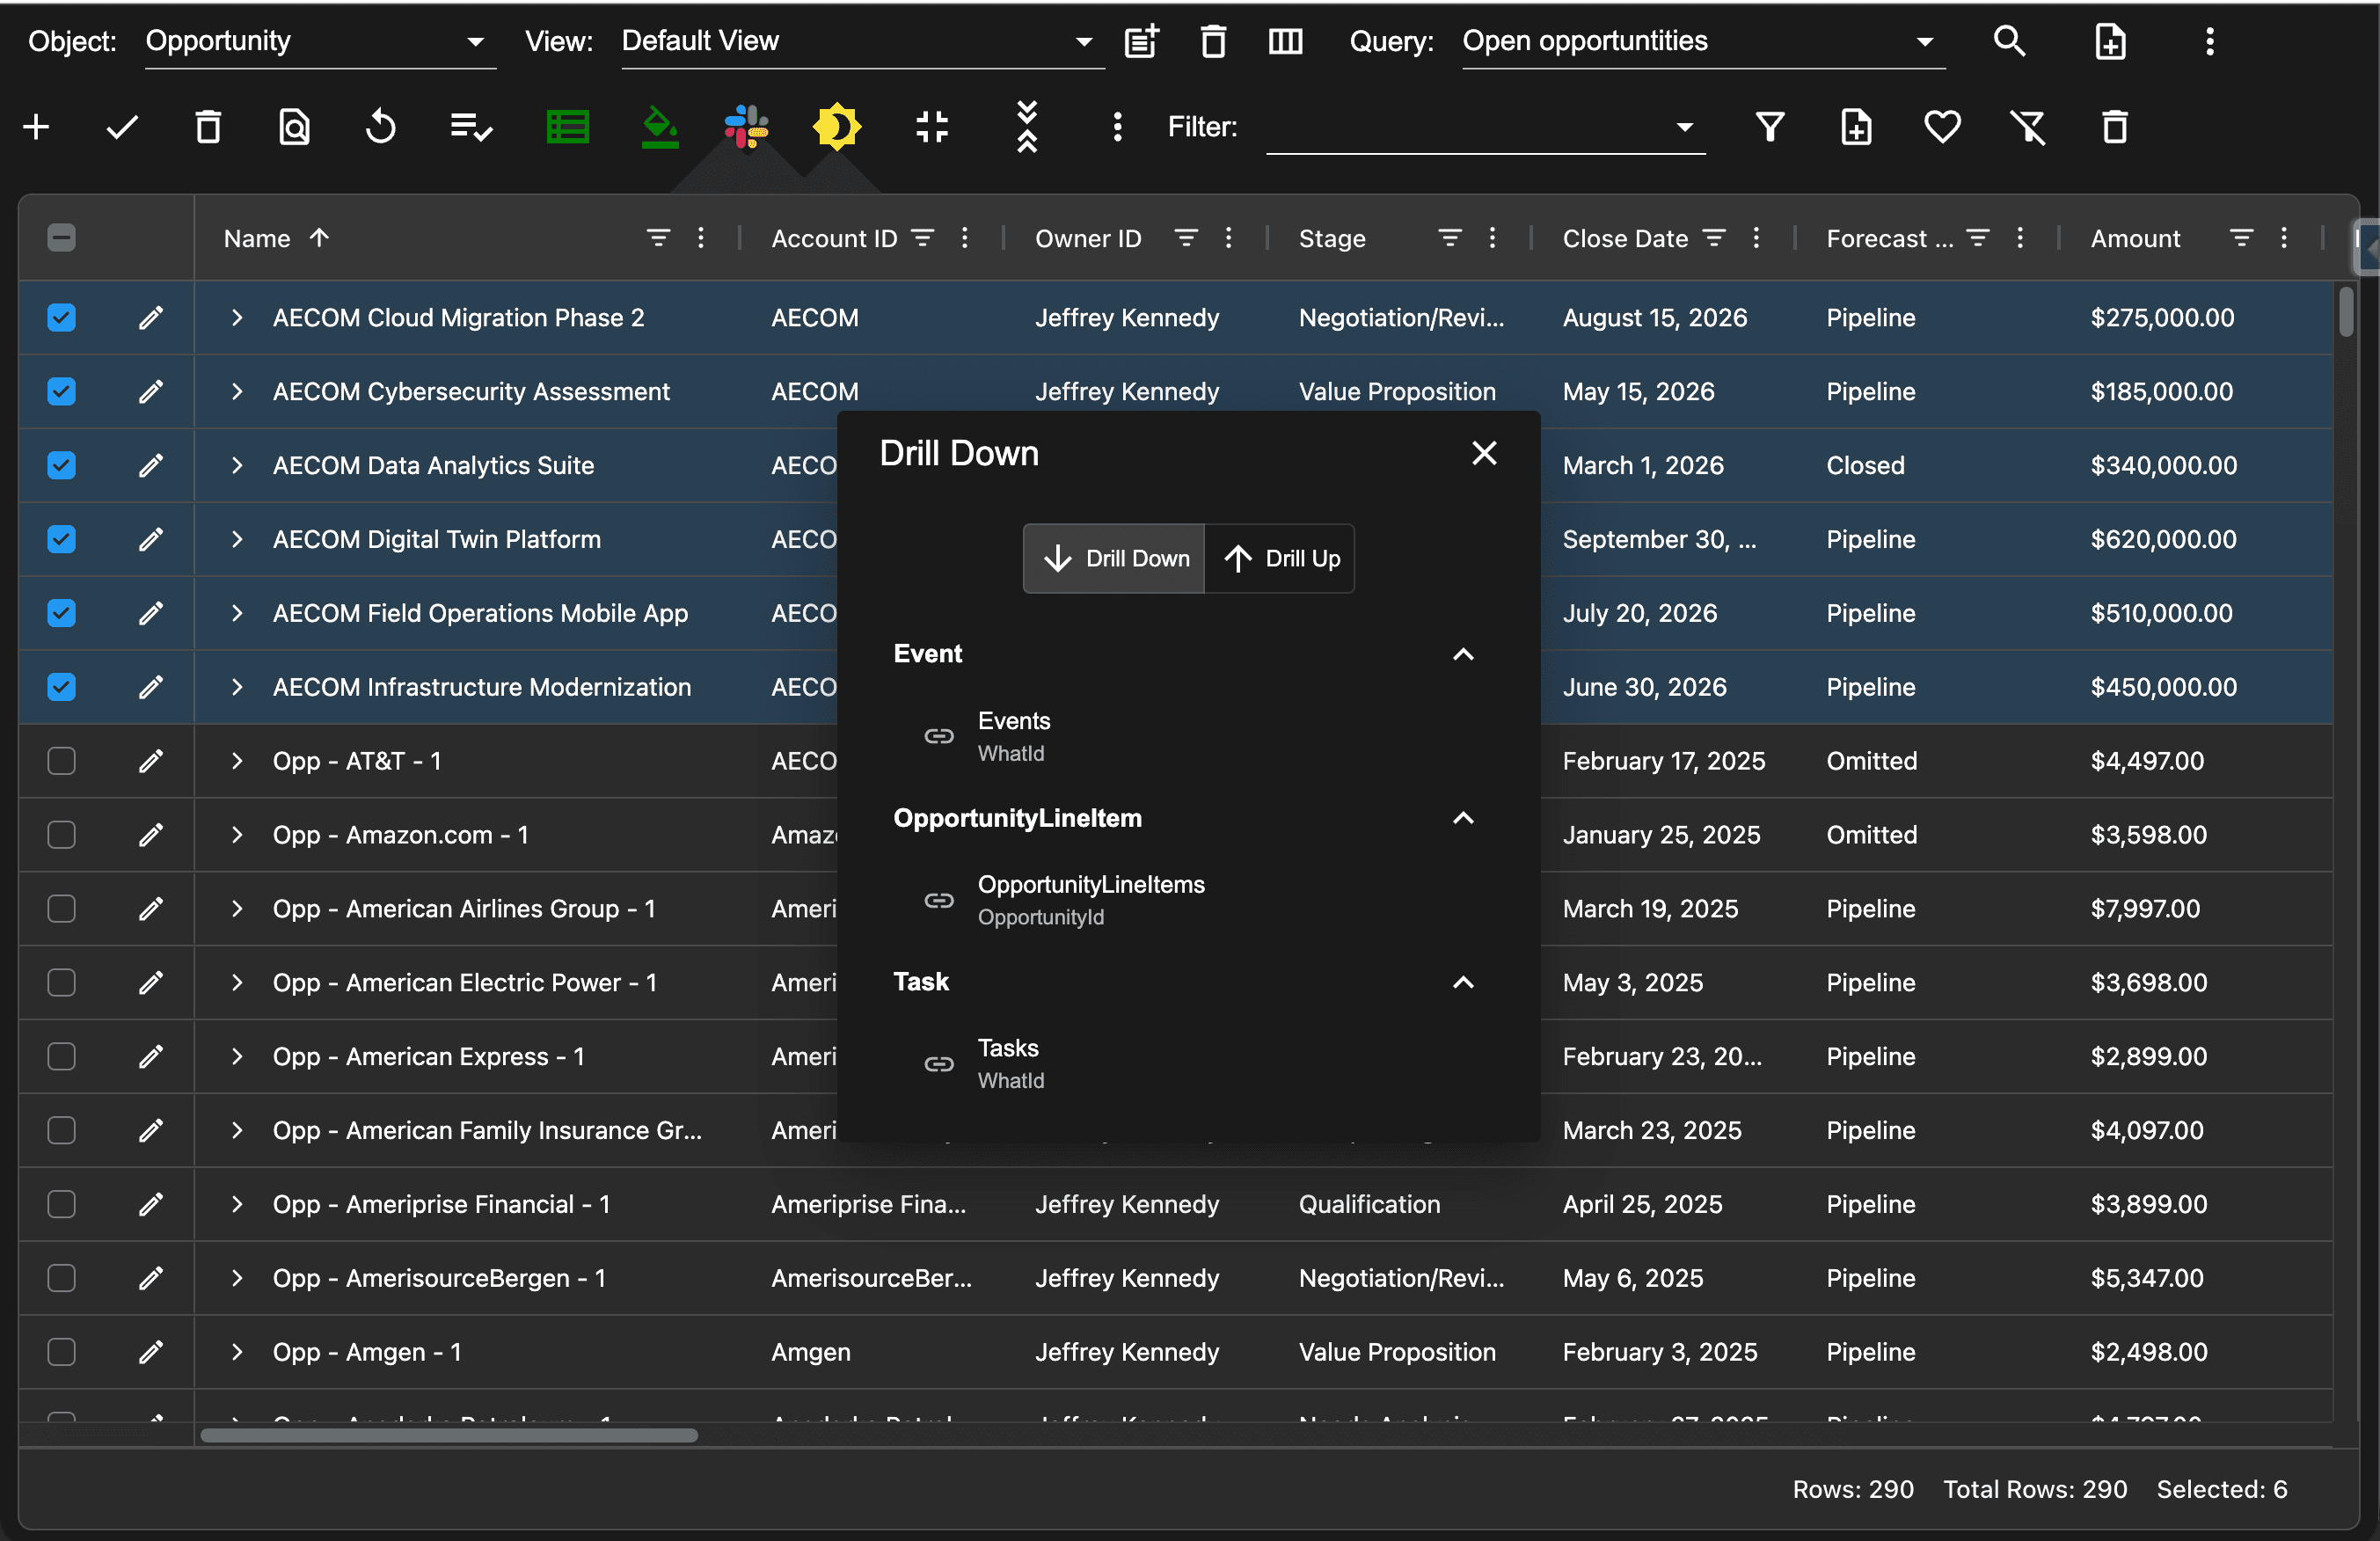
Or drill down to any child relationship of the selected object. The relationships that are shown are based on the users relation preferences for the parent object.
Using the native Salesforce UI limits you to working with one record's relationships at a time — click an Account, view its Contacts, take action, then repeat for the next Account.
AppGrid's Drill Up and Drill Down feature eliminates that bottleneck. Start with any filtered set of records, then navigate to their related parent or child records in a single step — giving you a flat, actionable grid of every related record across your entire result set. Combined with AppGrid's built-in Salesforce Flow integration, you can filter, navigate, and act without ever leaving the grid.
For example, imagine you need to send renewal notifications to Contract Managers at Accounts with upcoming SLA expirations. Instead of opening each Account one by one, simply query Accounts by expiration date, drill down to Contacts and you instantly have every Contact across all of those Accounts in one grid.
Filter to the Contract Manager title, select them all, and trigger your notification Flow — a task that used to take dozens of clicks is now done in seconds.
The same pattern works in reverse: a sales manager reviewing pipeline risk can query early-stage Opportunities closing this quarter, then drill down to Tasks to see which deals lack recent activity — or drill up to Accounts to assess account health — all from a single starting point. Filter, navigate, act: that's the power of Drill.
Viewing related data
AppGrid provides the ability to display all main and related data on a single page which vastly improves the visibility of information over the native Salesforce UI. Before viewing related data, make sure you have configured your relation preferences for the selected object.
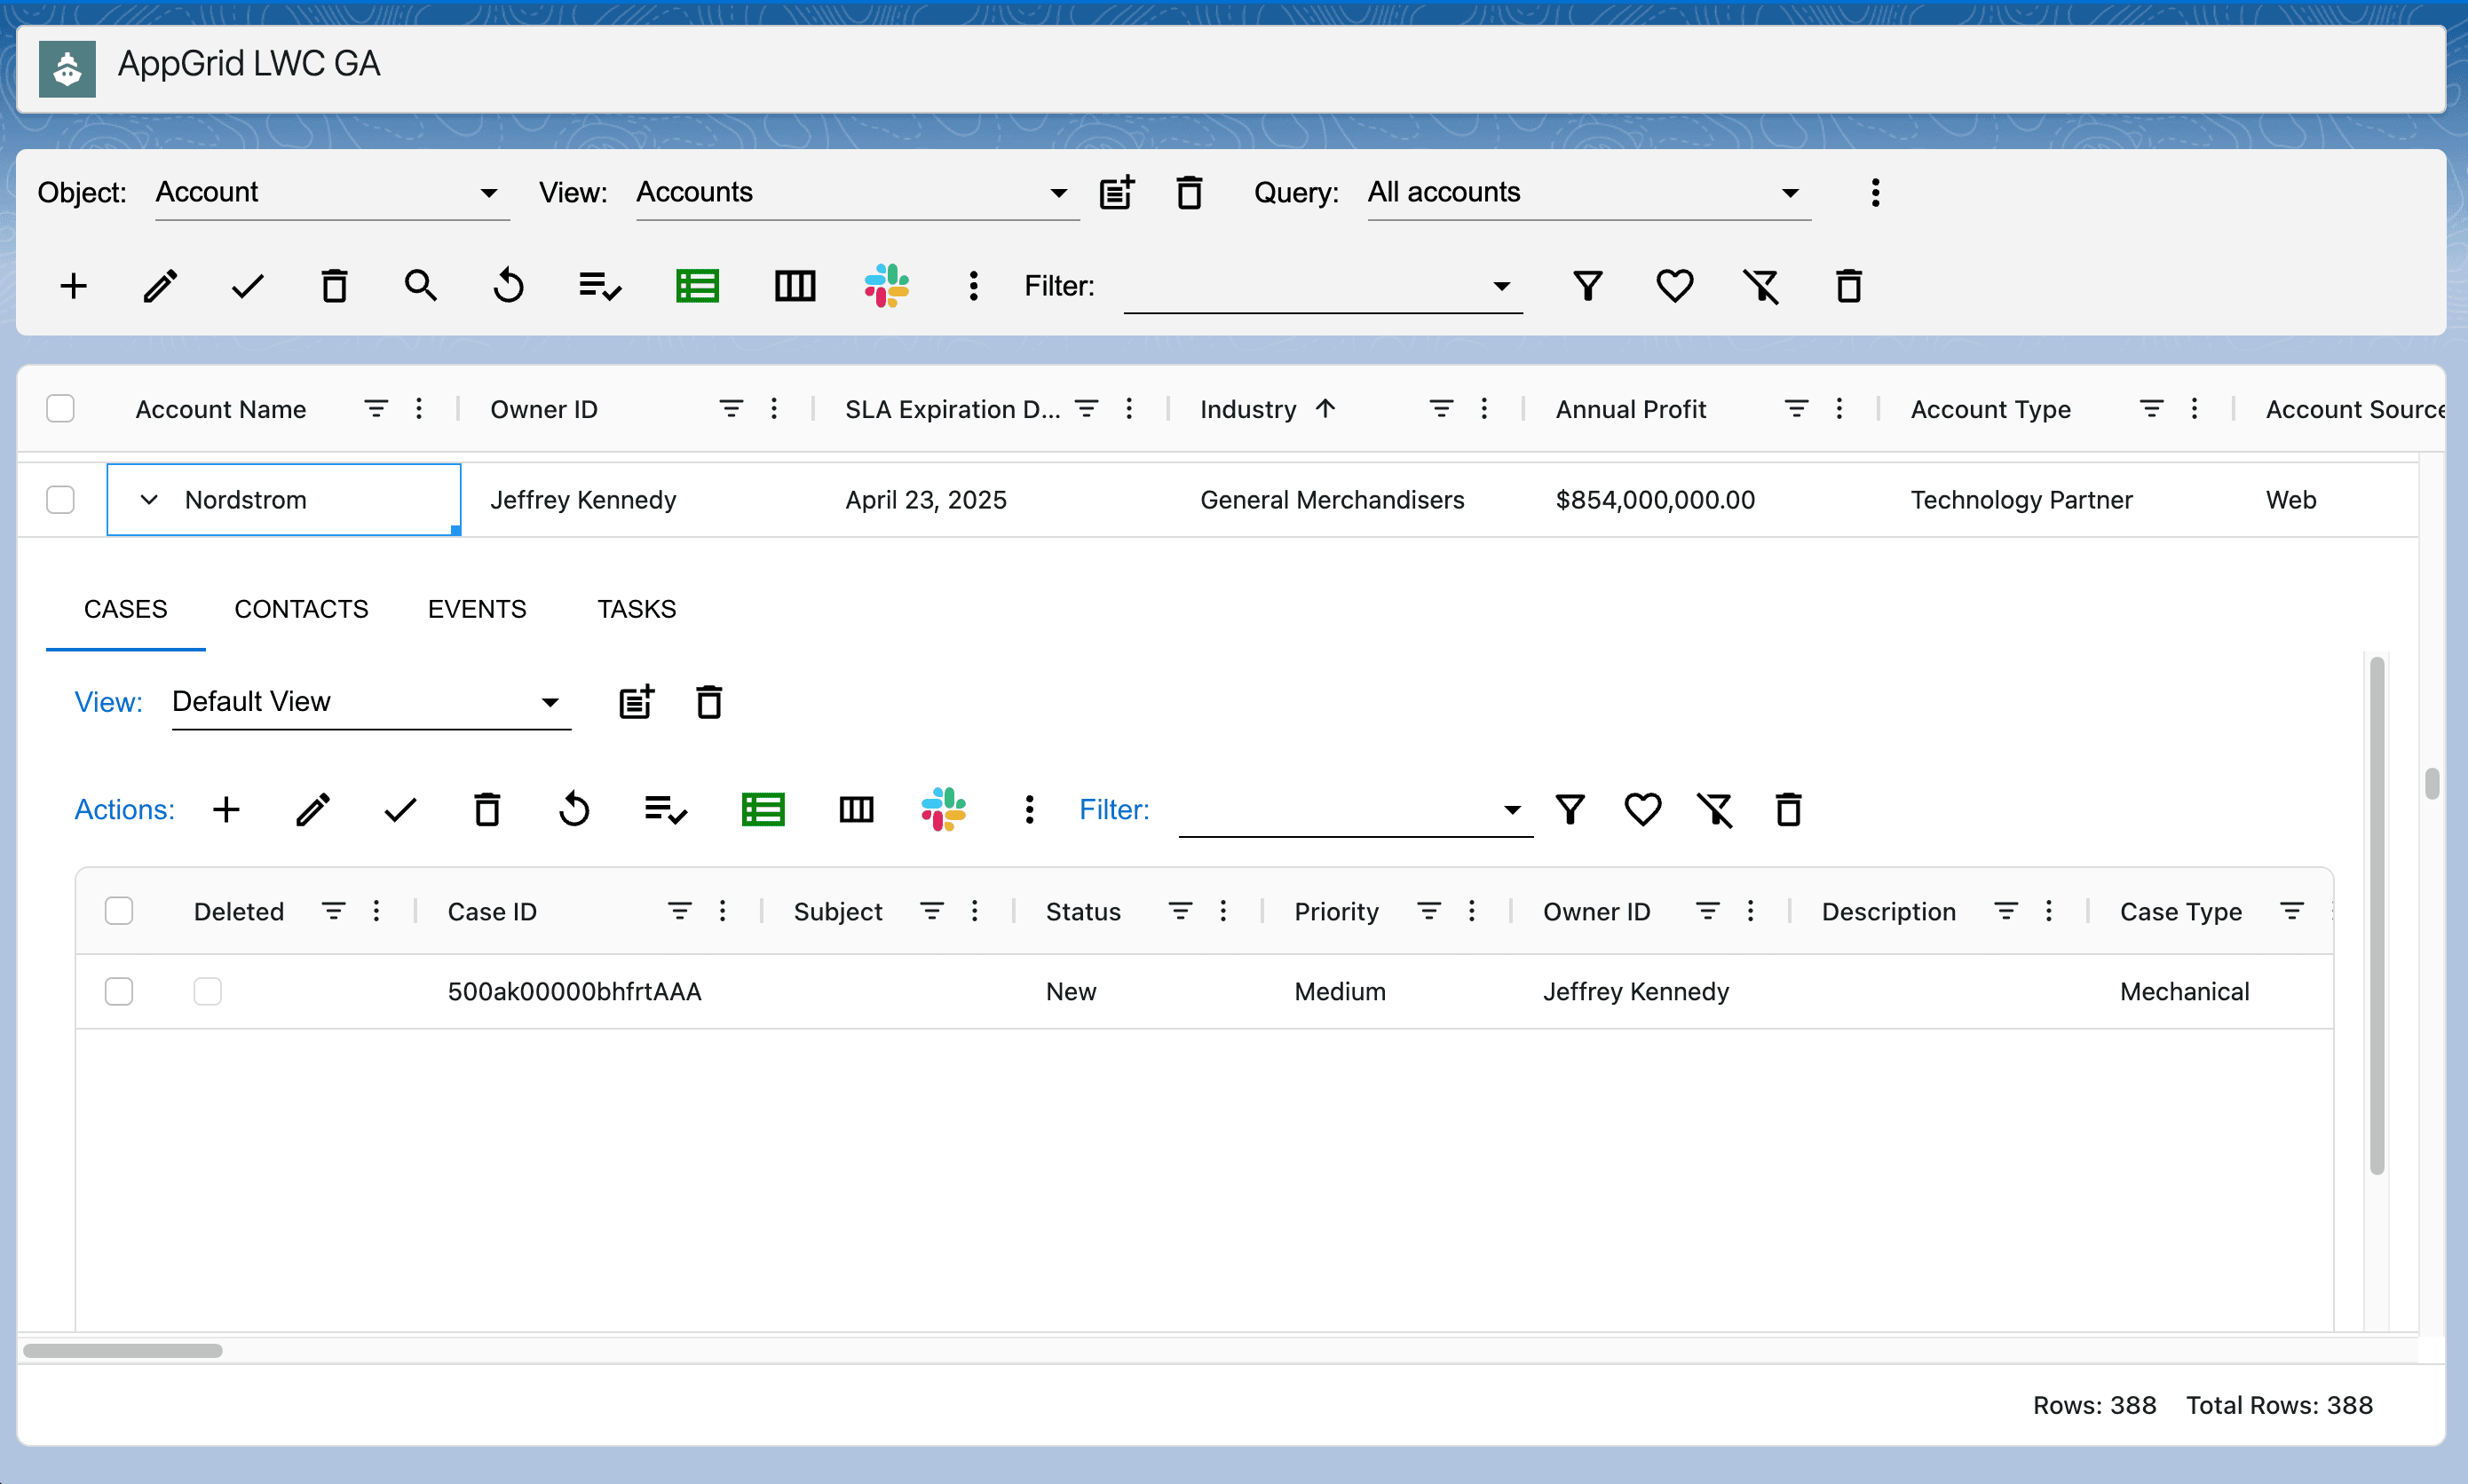
To view related data, click the subrow indicator next to the first grid column. The related data will be displayed in a tab control with a subgrid for each relationship. The subgrids have the same features and capabilities as the main grid.
Creating & using charts
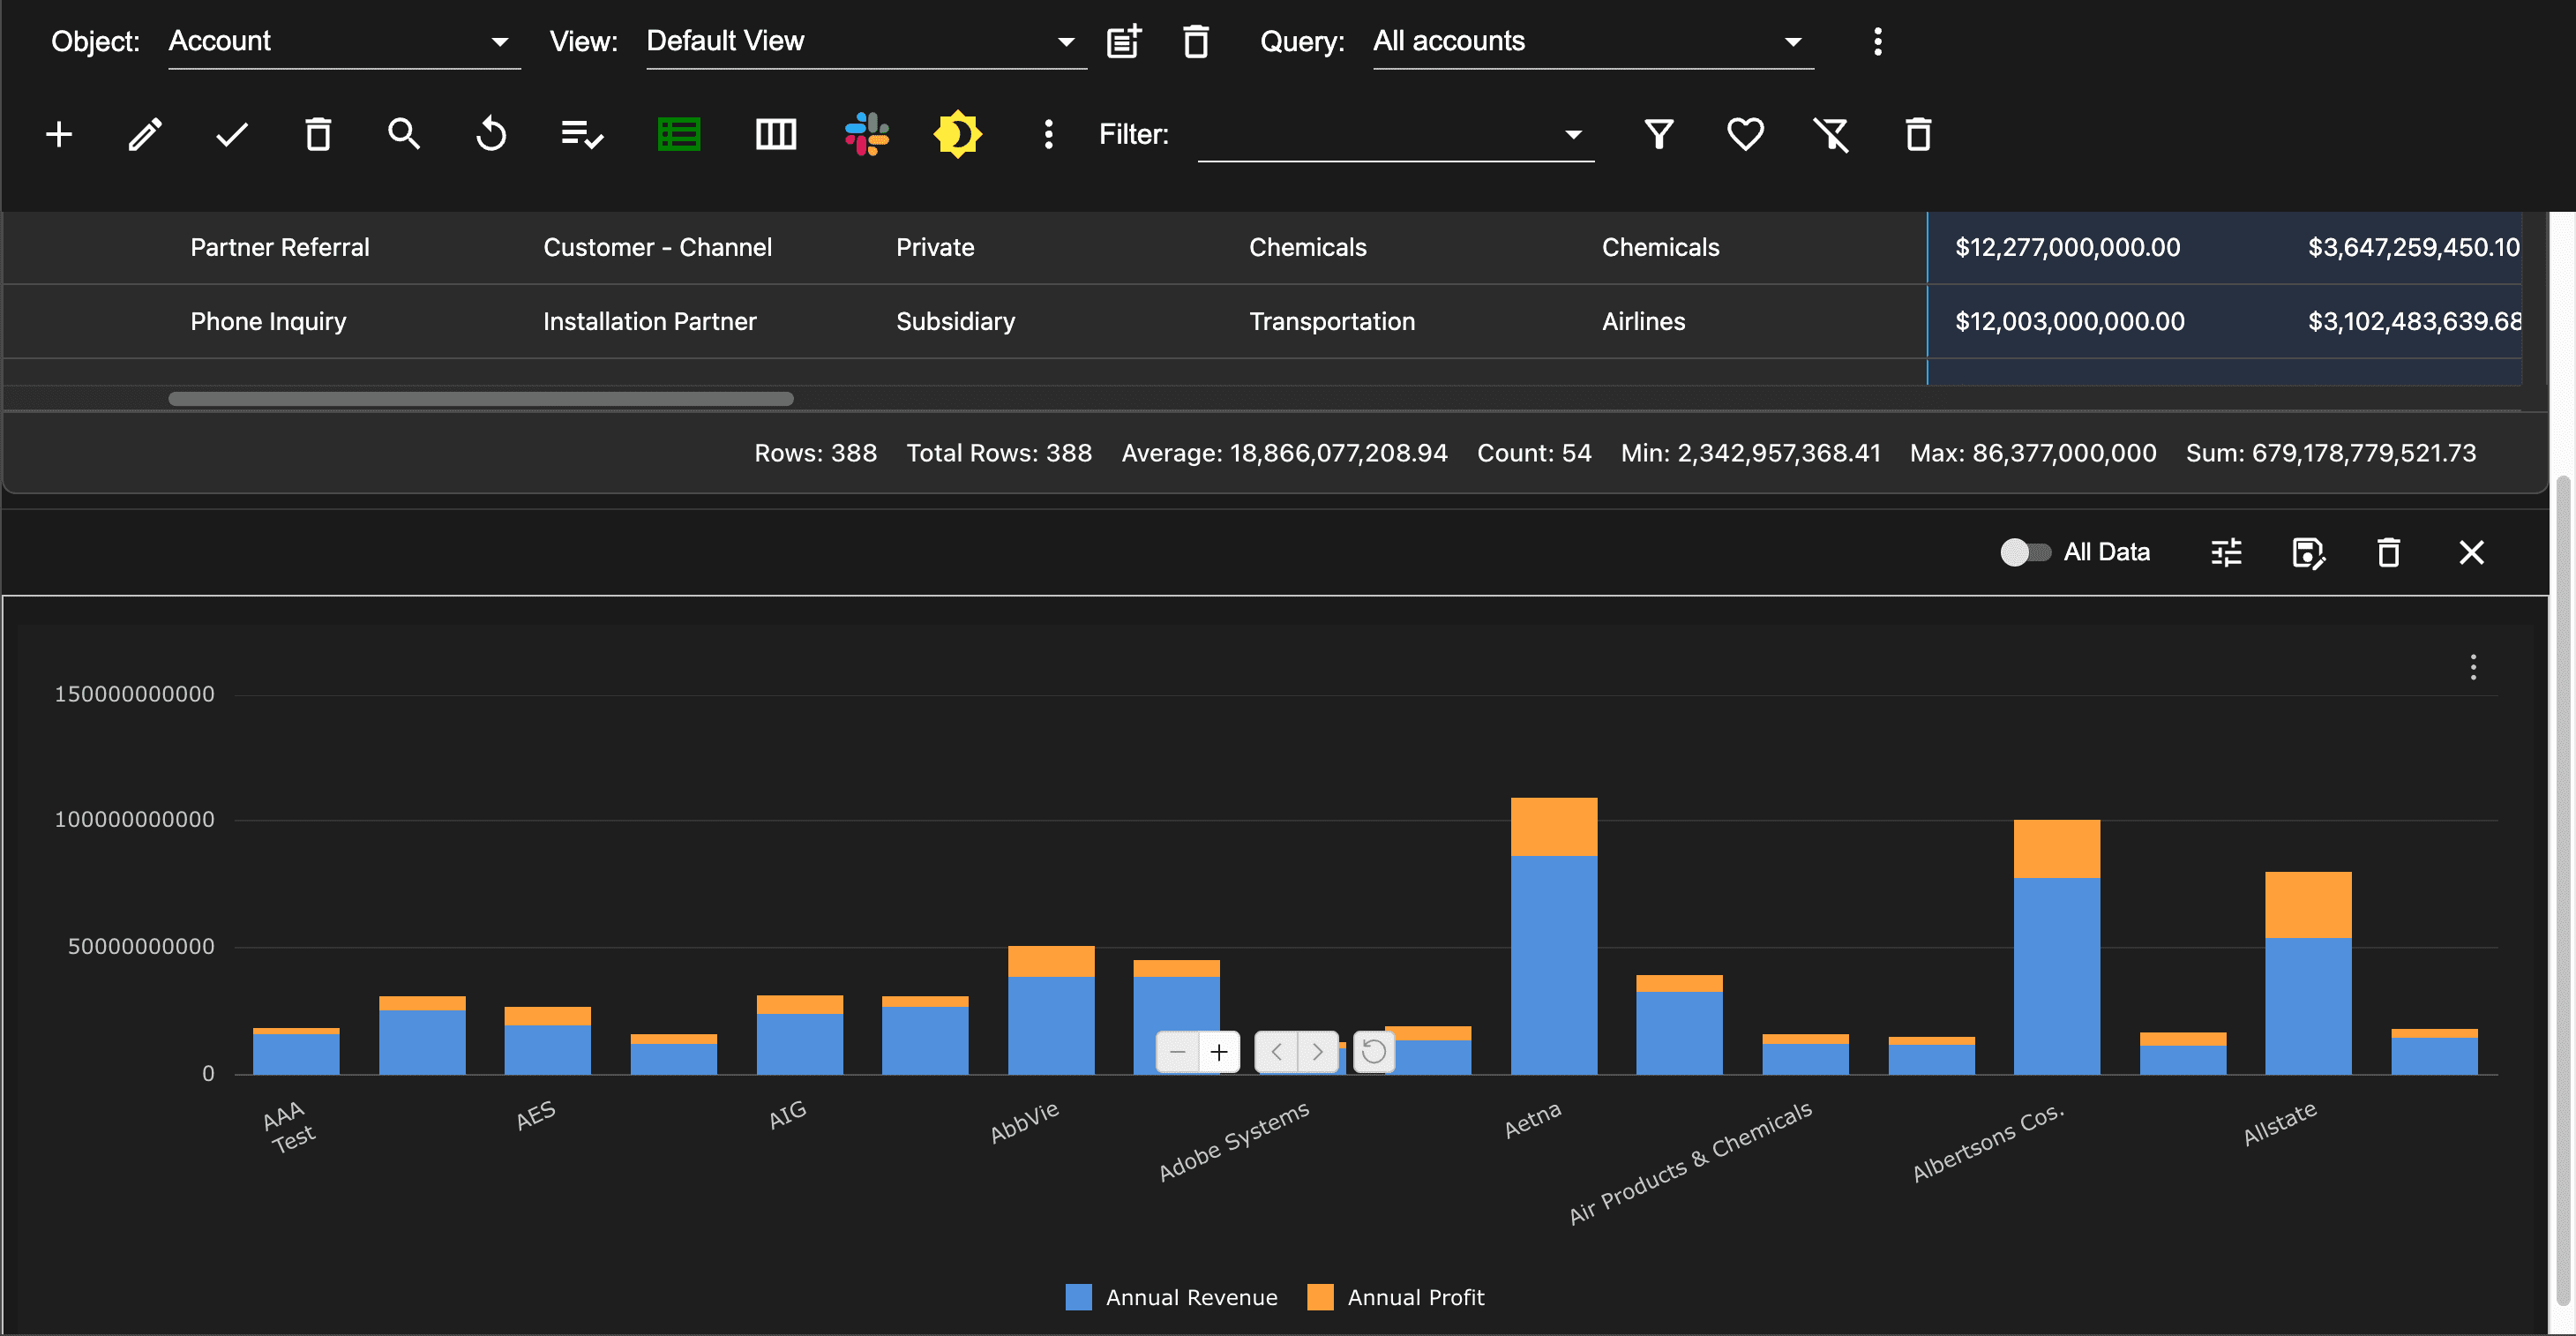
AppGrid provides the ability to dynamically create charts using our enterprise charting technology. To create a chart, drag-select multiple columns and rows. Be sure to include at least 1 numeric column. Right-click and select the chart type. The chart will be created from the selected data. You can toggle the All Data radio button and the chart will display the current query data. You can execute a different query and the chart will update. You can also filter the grid and see the chart update.
AppGrid charts provide a rich set of configuration options you can use to customize your chart. Click the chart settings button to open the chart wizard. Watch the video for a detailed demonstration of how to create, save and delete charts.
Deployment best practices
It is highly recommended to follow the AppGrid deployment best practices before rolling out AppGrid to your users. The reason for doing this is that each user will have an AppGrid that is already configured for their workflows which will make them immediately productive and improve the user experience. See the blog post named Deploying AppGrid - best practices.
Sorting
To sort the grid records, click on a column header. The grid records will be sorted in ascending order. The column header will display an arrow icon indicating the direction of sort. To sort in descending order, click the column header again. A third click on the column header will remove the sort. To sort on multiple columns, hold the shift key and click another column header. You will see a number beside the column icon which indicates the sort priority.
Team sharing
Team Sharing promotes collaboration by allowing colleagues to share AppGrid views and queries. Team sharing can be enabled for a given user by setting the Team Sharing grid permission. The process of sharing views and queries is very similar. Open the column manager to share a view or open the query builder to share a query. Let's look at sharing a view by opening the column manager.
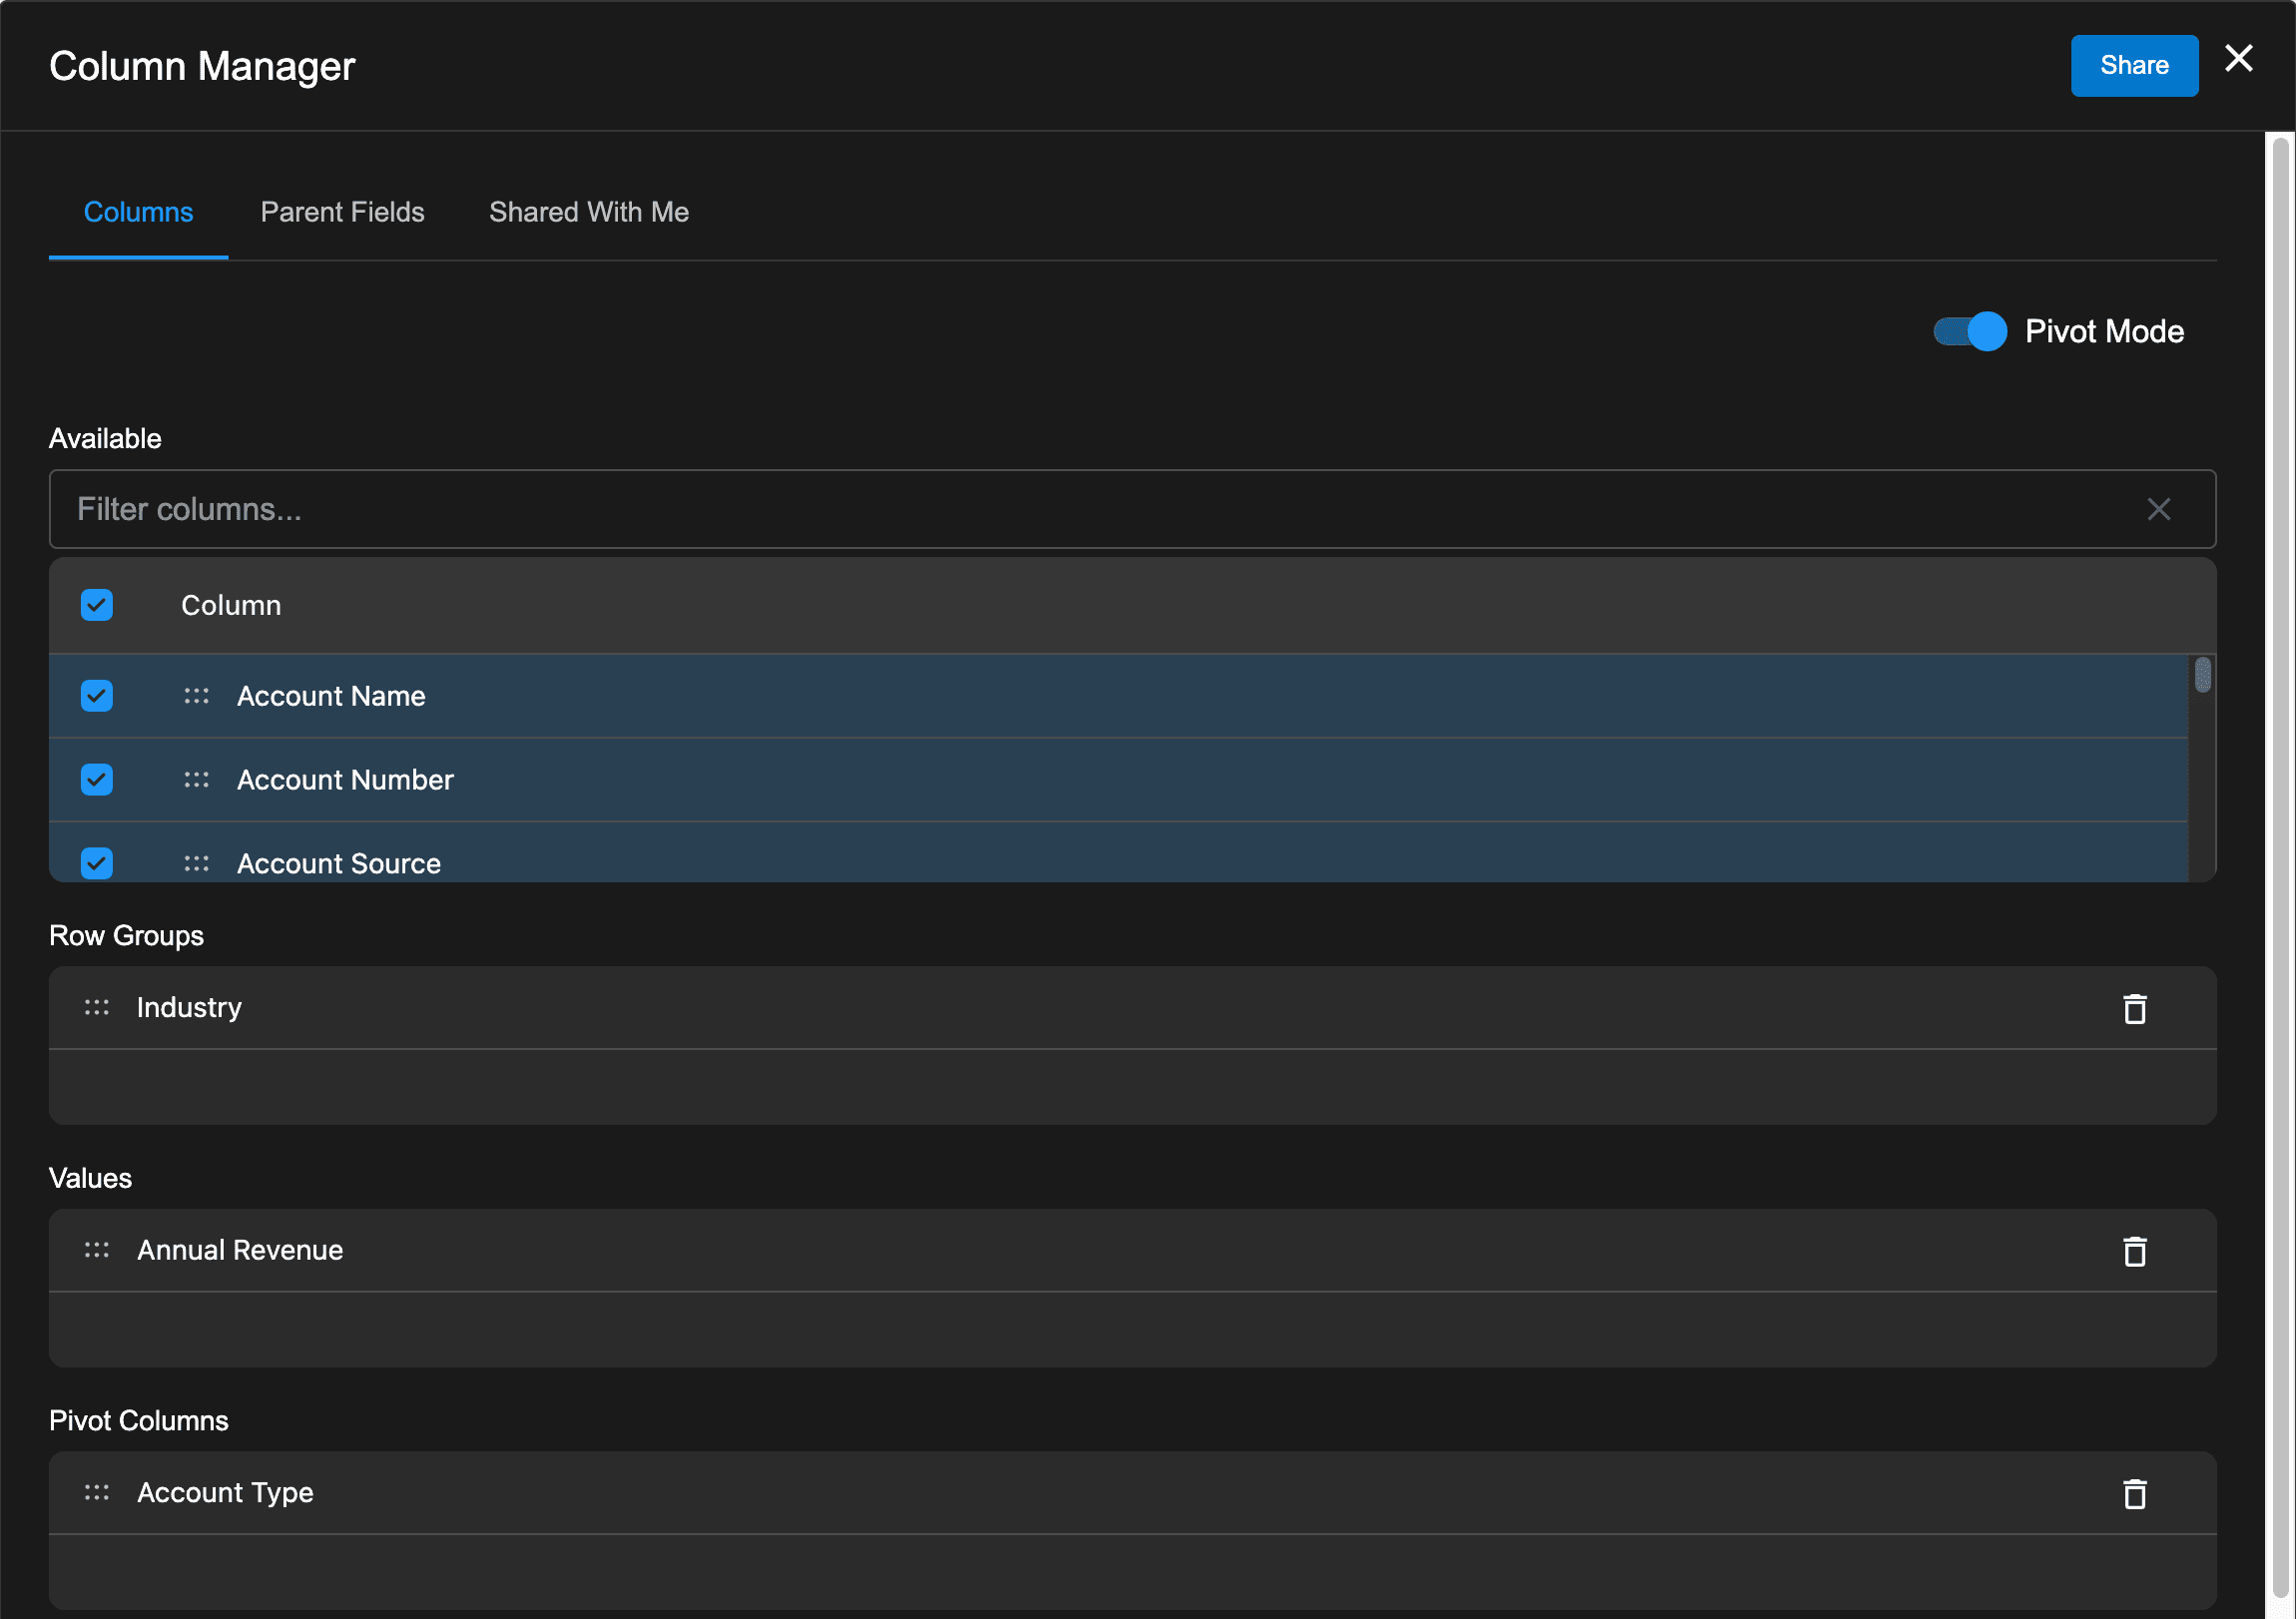
To share a view, click the Share button. A dialog will open that allows the user to share the view with selected users, all users or users that have a specific profile.
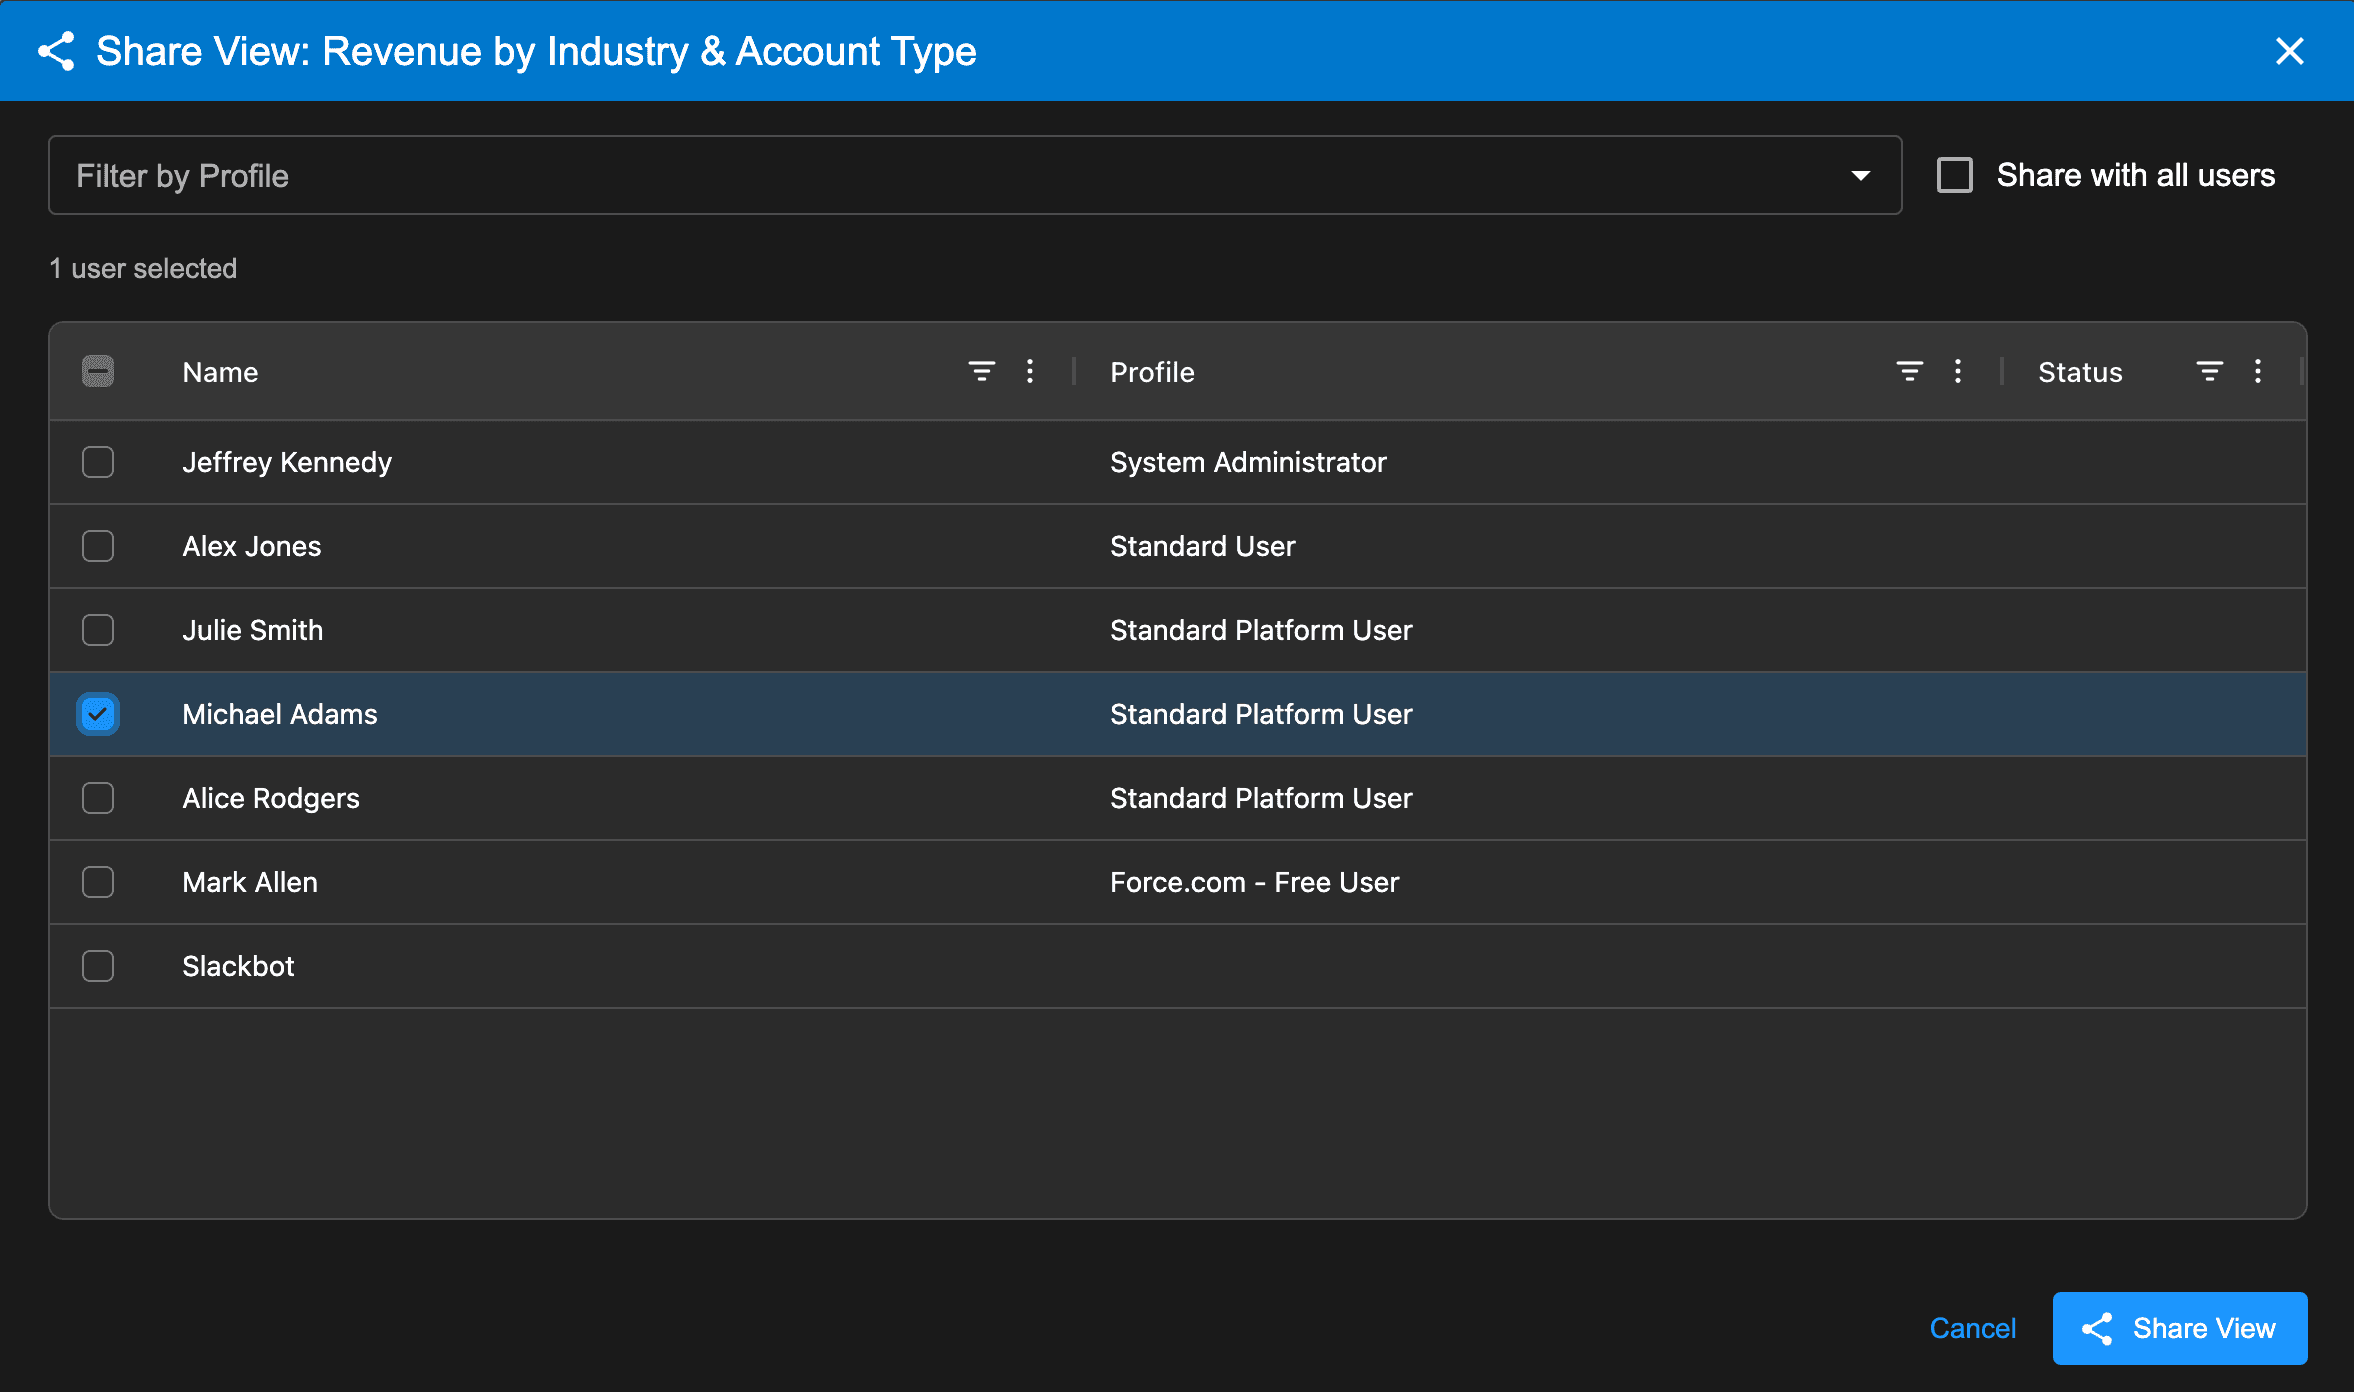
After clicking the assign button, the selected users will now have access to the view. The assigned users will receive a notification when AppGrid loads that a new shared view is available for download. If the user wants to use the shared view, they open the column manager and select the Share With Me tab.
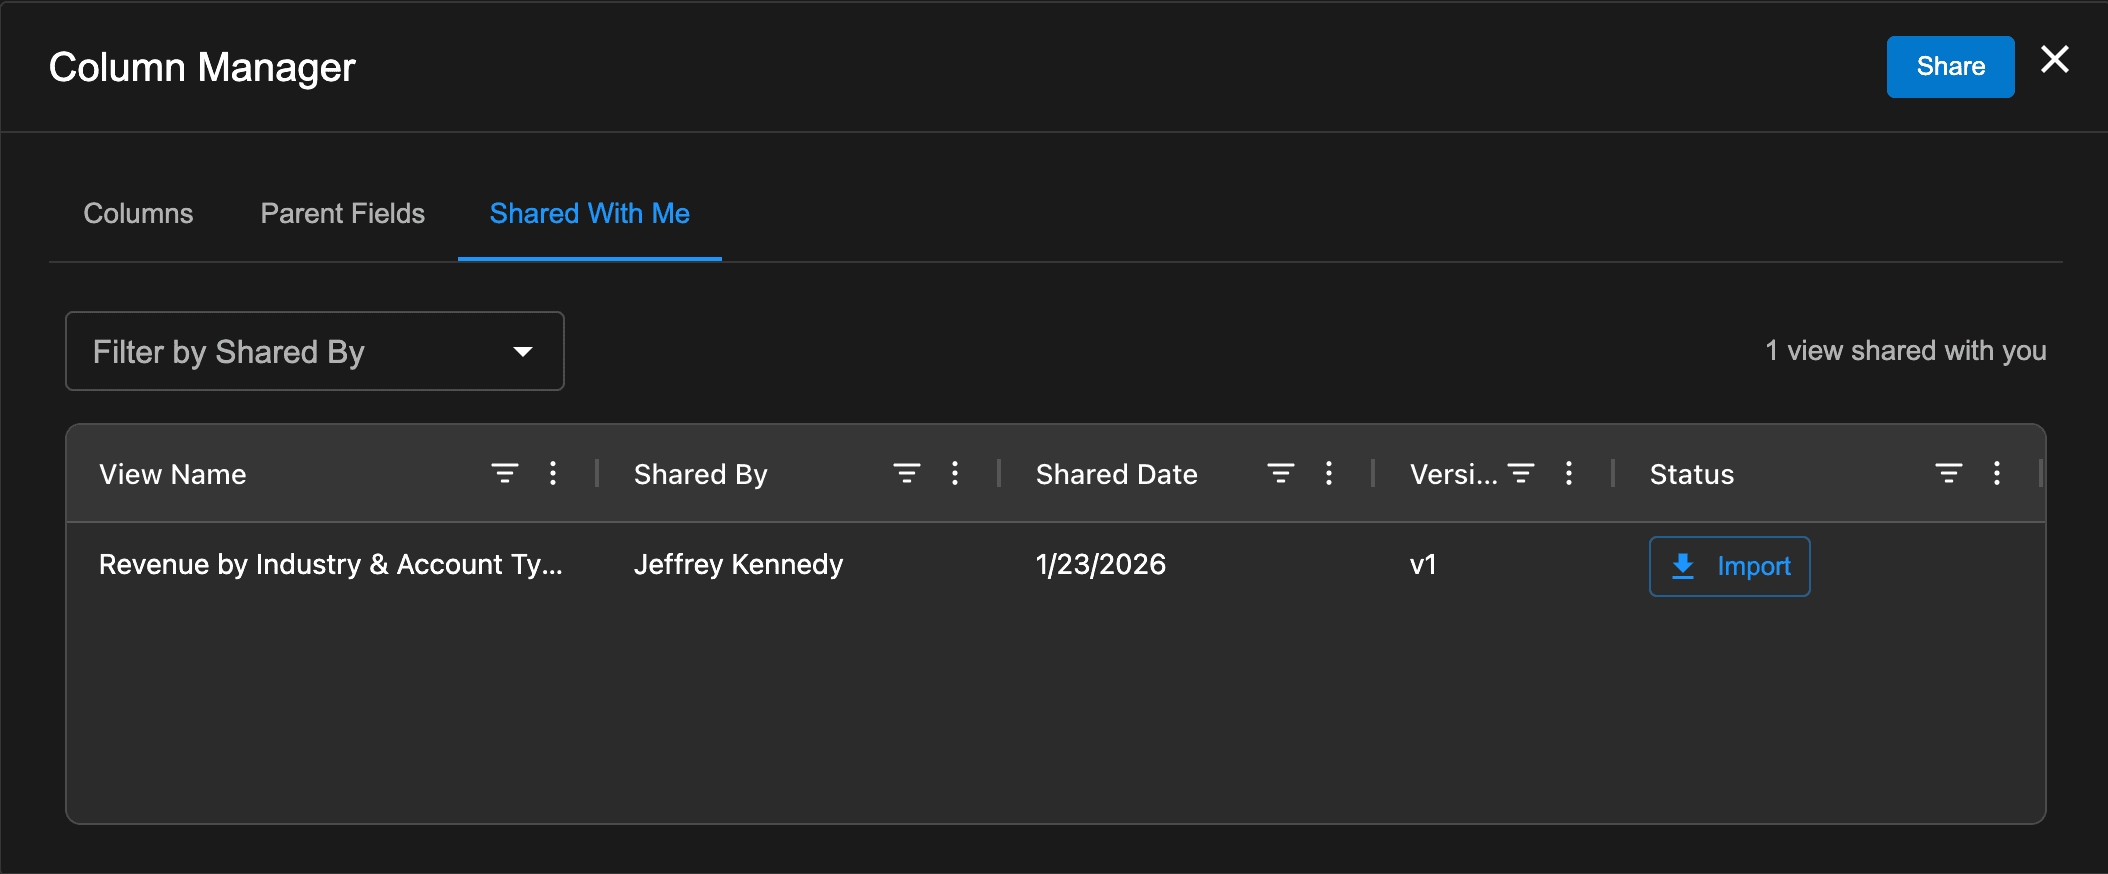
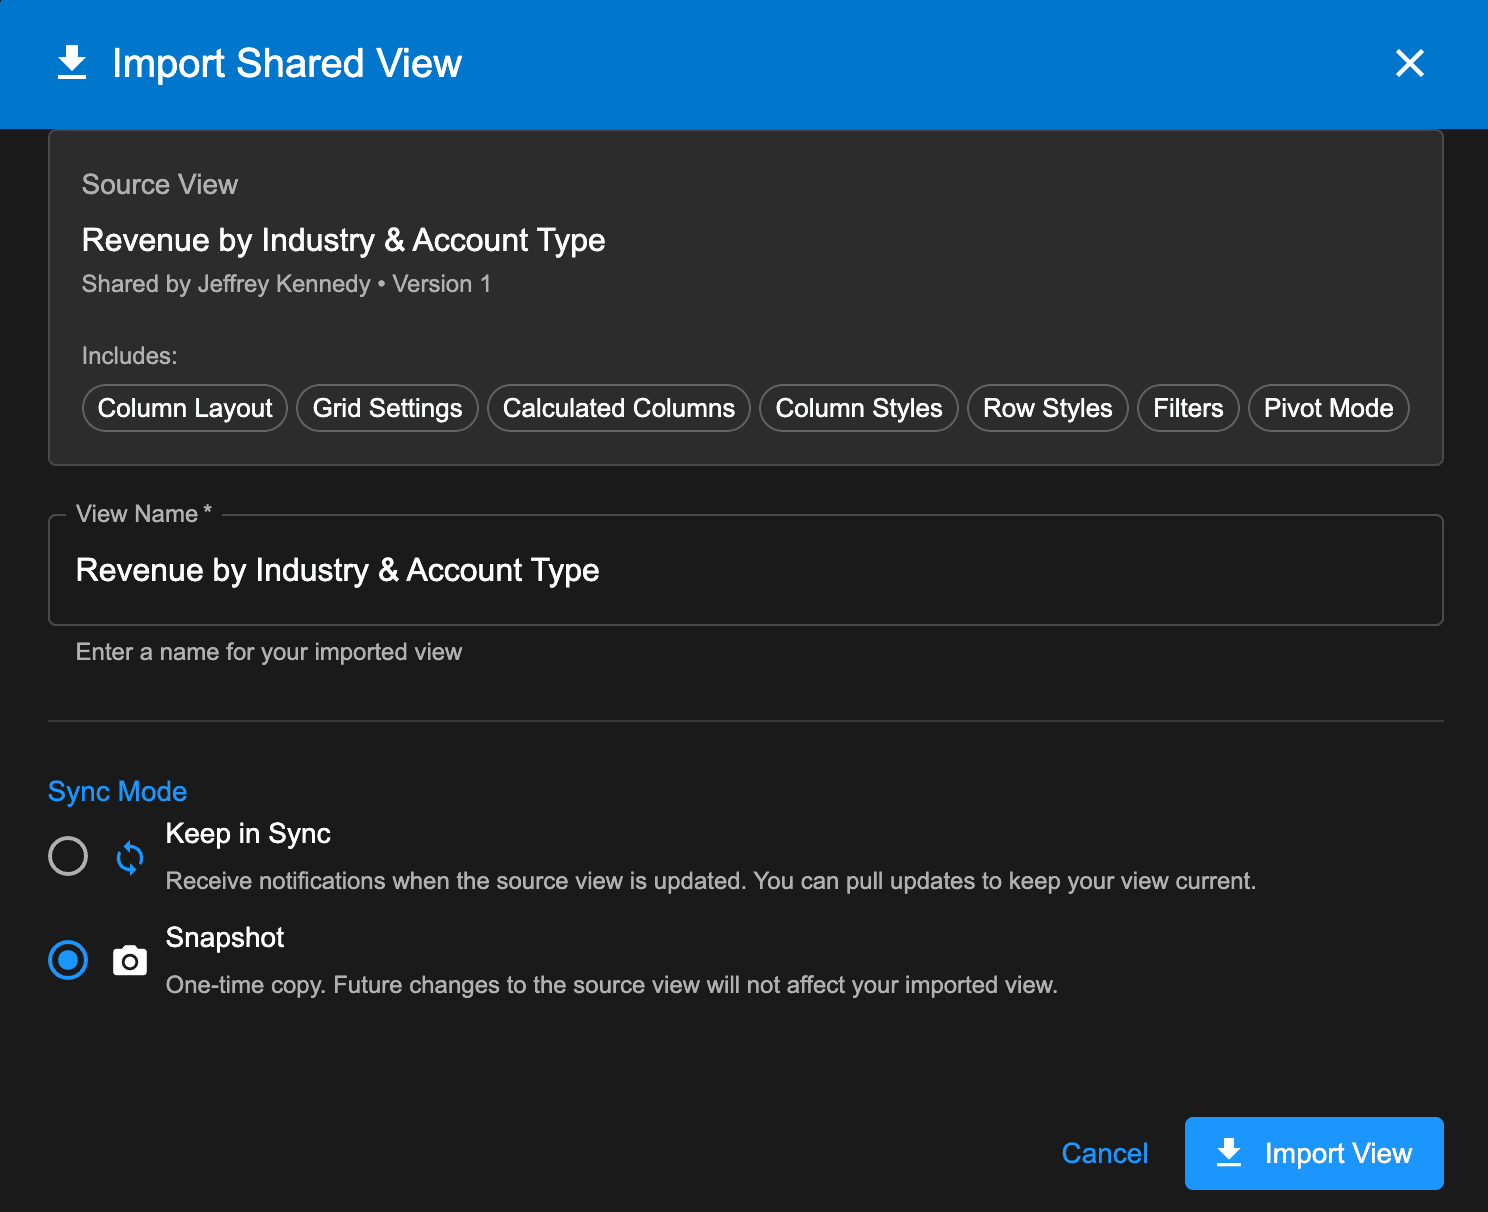
The Share tab will display a list of all views shared to this user. Each shared view will display a button to import or update the shared view. When the Import button is clicked, the next step will be displayed where the user can choose to keep the view in sync with changes made by the view author or import a snapshot of the view. If the user chooses to keep the view in sync, any changes made to the view by the author will be reflected in the subscribers view and will overwrite any changes to the view made by the subscriber.
Quick info
AppGrid provides a handy way to perform a quick calculation of column values. Click and drag across any numerical column records. In the footer you will see the sum, min, max, average and count of the selected rows.
Import from Excel
There are many 3rd party applications you can use to import data, albeit at the cost of learning a new tool and incurring additional expense. If your requirements include schedulng and bulk imports, then that is the right choice.
We wanted to provide our users with an easy to use application that any business user can use without training. Select the Import menu item from the grid More Actions menu and select the file to import. You can import Excel files and CSV files. The import wizard supports inserting new records and upsetting existing records at the same time.
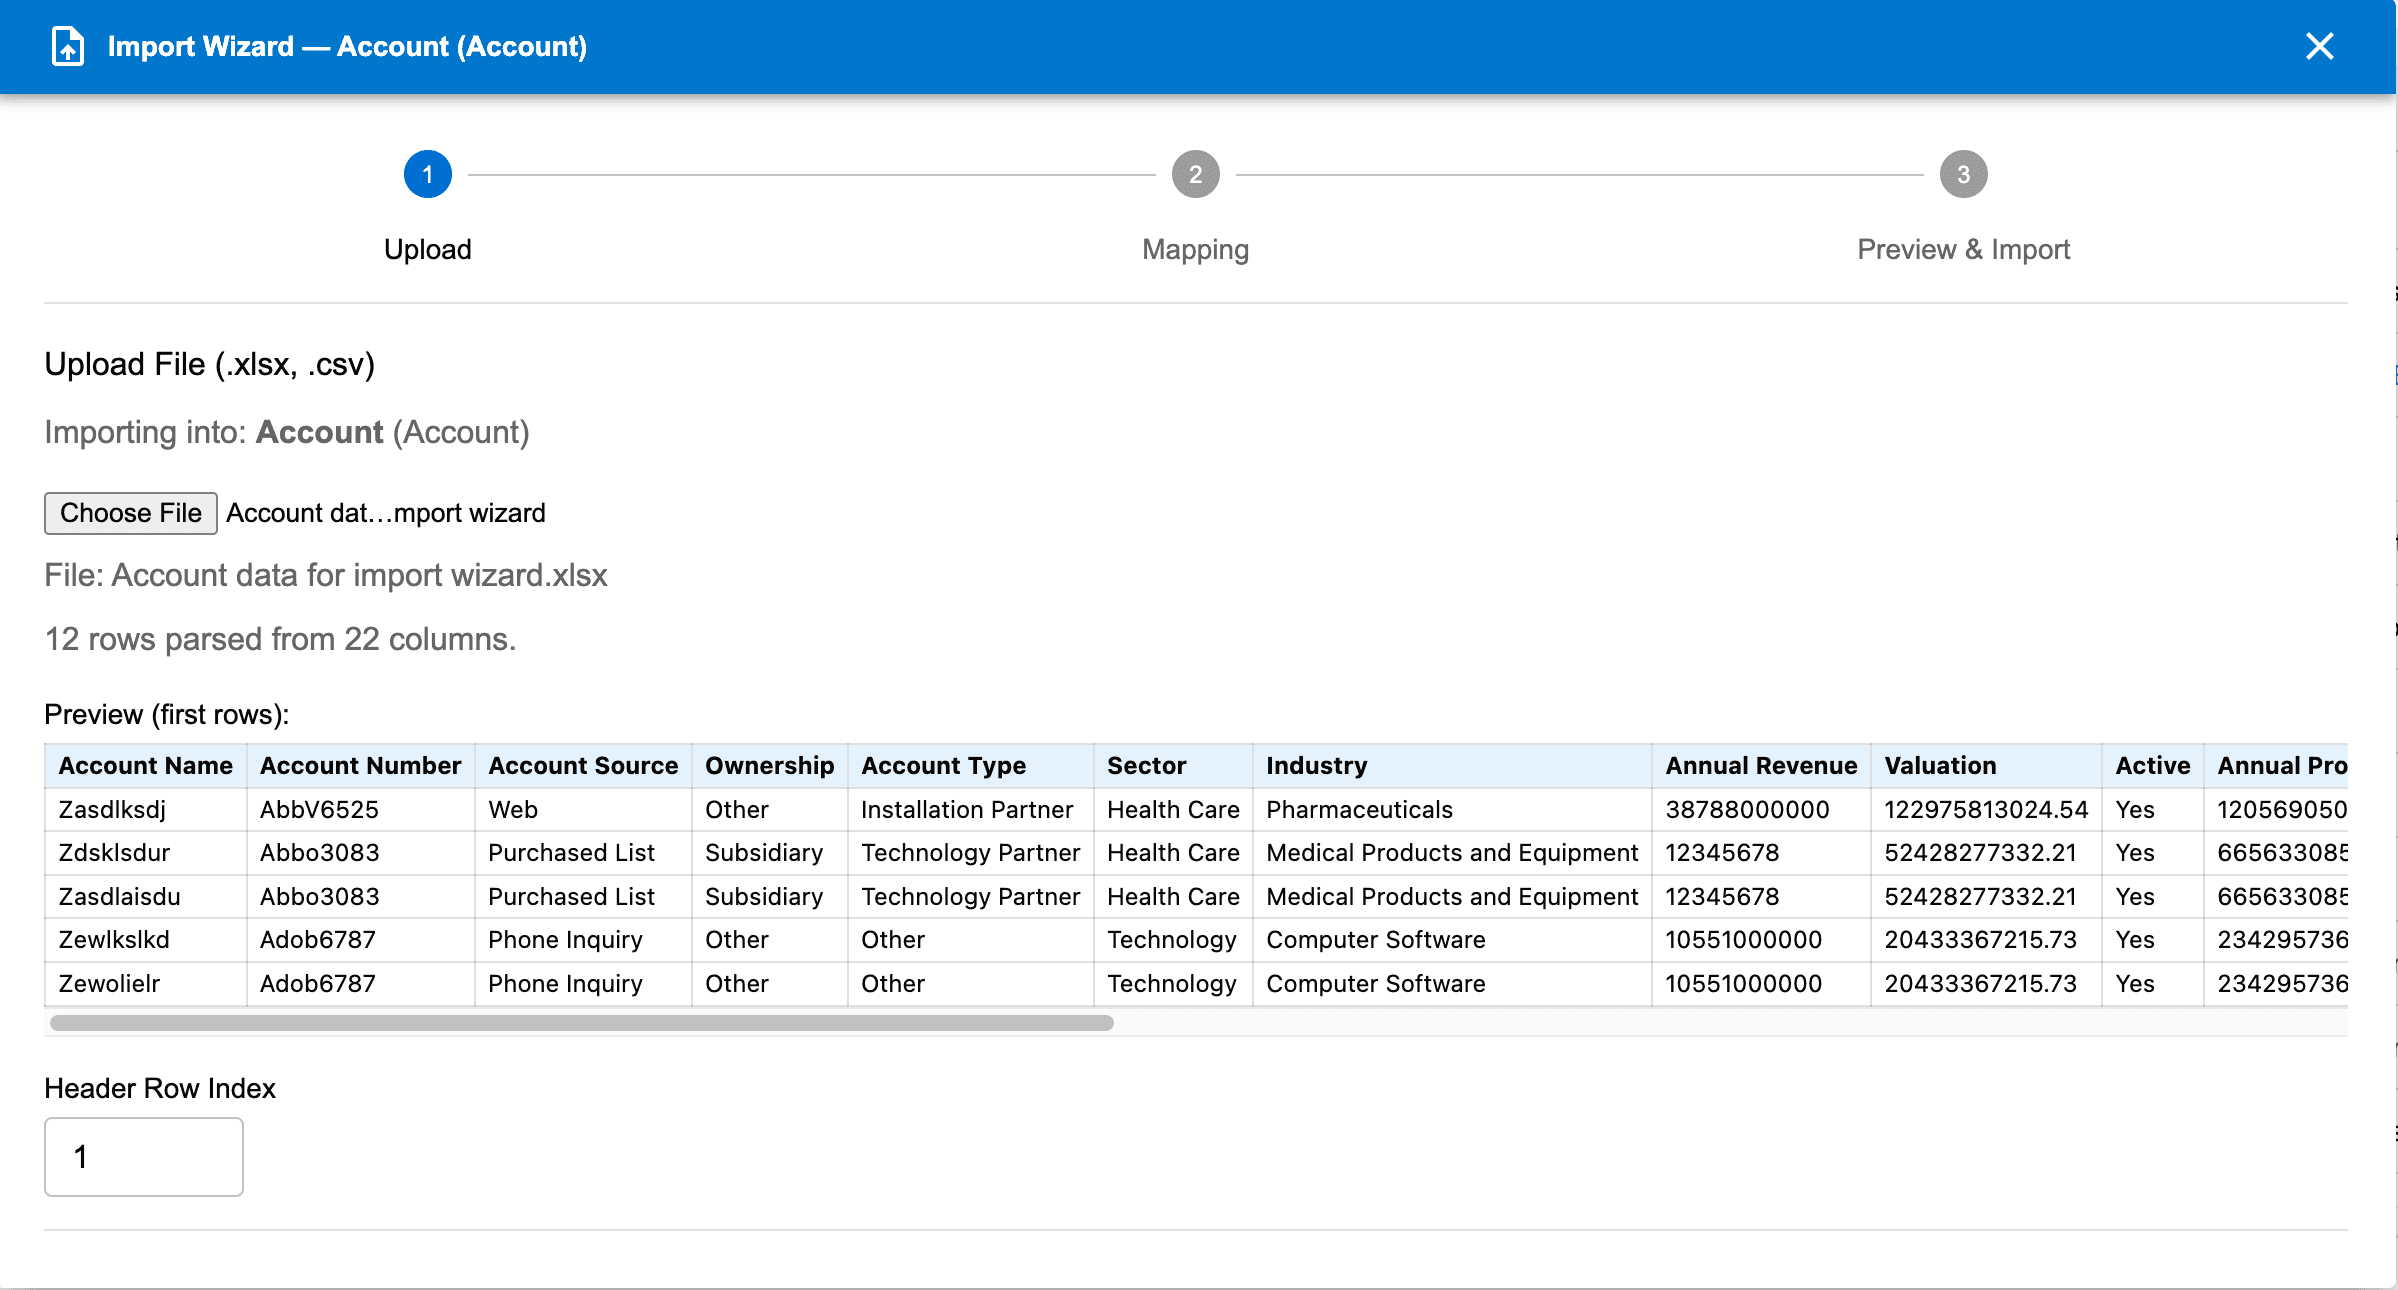
If the import wizard detects both an Id column and ExternalId column, a dropdown will be displayed that allows you to choose which field will be used for matching upserts.
If you are only inserting new records, you should delete the Id column. If you have a mix of records that you want to insert and update, then delete the value of the Id column for any records to be inserted.
As best practice, you should not have any system, read-only or calculated columns in your import file.
Click the next button to display the mapping step.
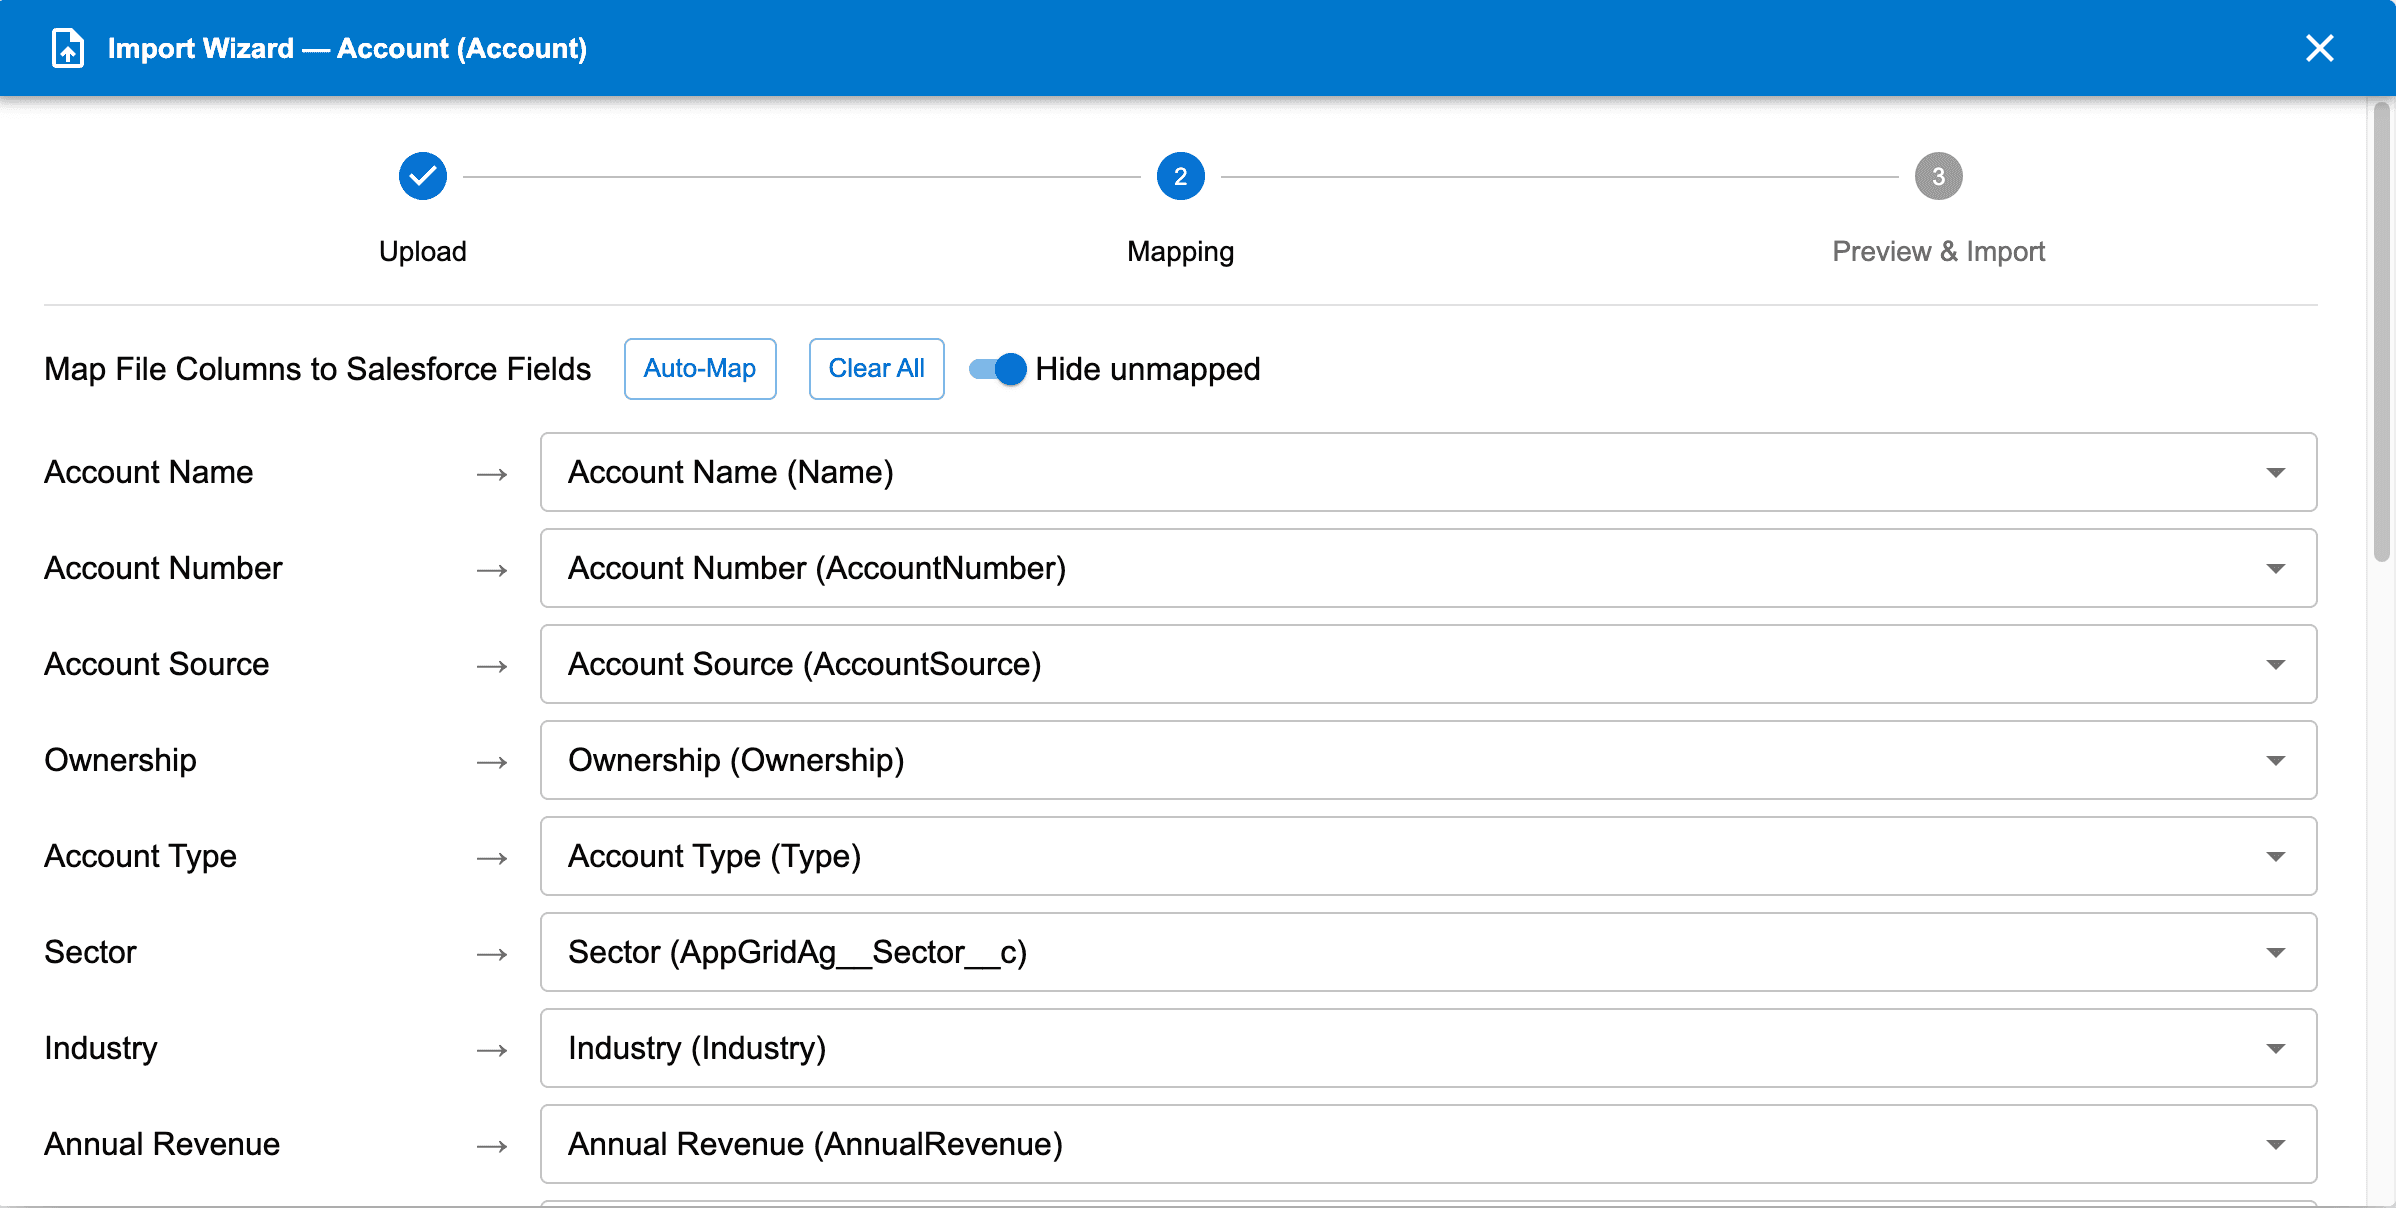
AppGrid will automatically map the fields to the extent possible. For any un-mapped fields, choose the correct Apex field. Click the next button to display the preview page.
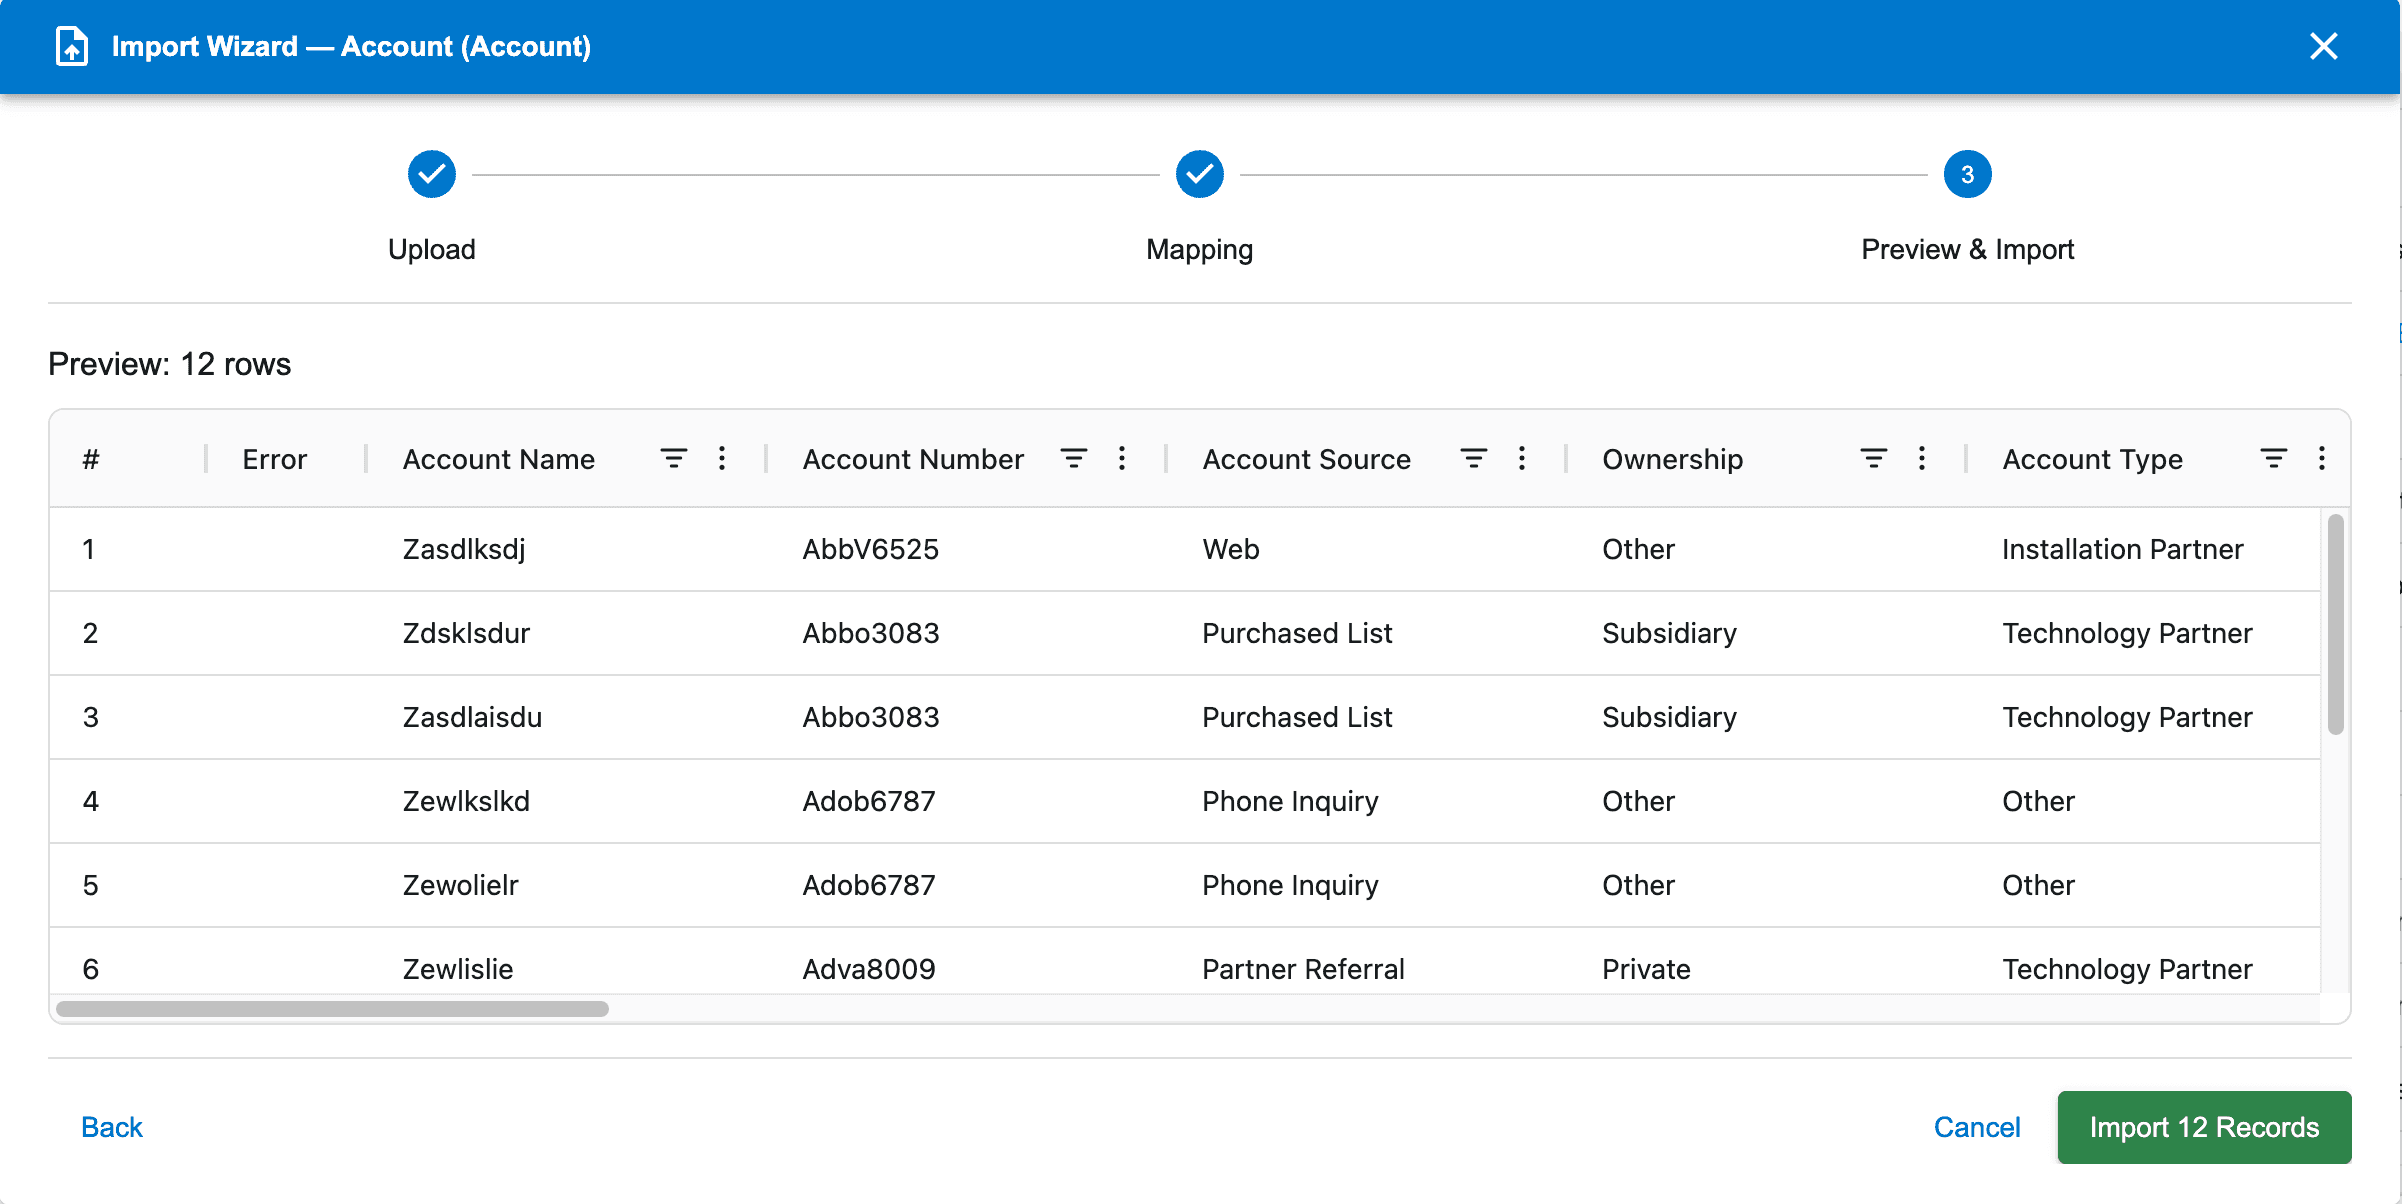
Review the data to be upserted and make any changes as required. Click the Import button when ready. A success notification will be displayed if the upsert was successful. If any records fail to upsert, an error icon will be displayed on each row and the records successfully updated will be removed from the grid. Hover over the icon to see the error message. Click the Retry button once you have fixed the data.
Export to Excel
AppGrid provides the ability to export grid data to Excel or to a CSV file. You can either export the selected cells or all grid data. To export the selected cells, make a selection and then right-click and select Export to Excel. You will be presented with a dialog where you can enter a name and location for the export file.
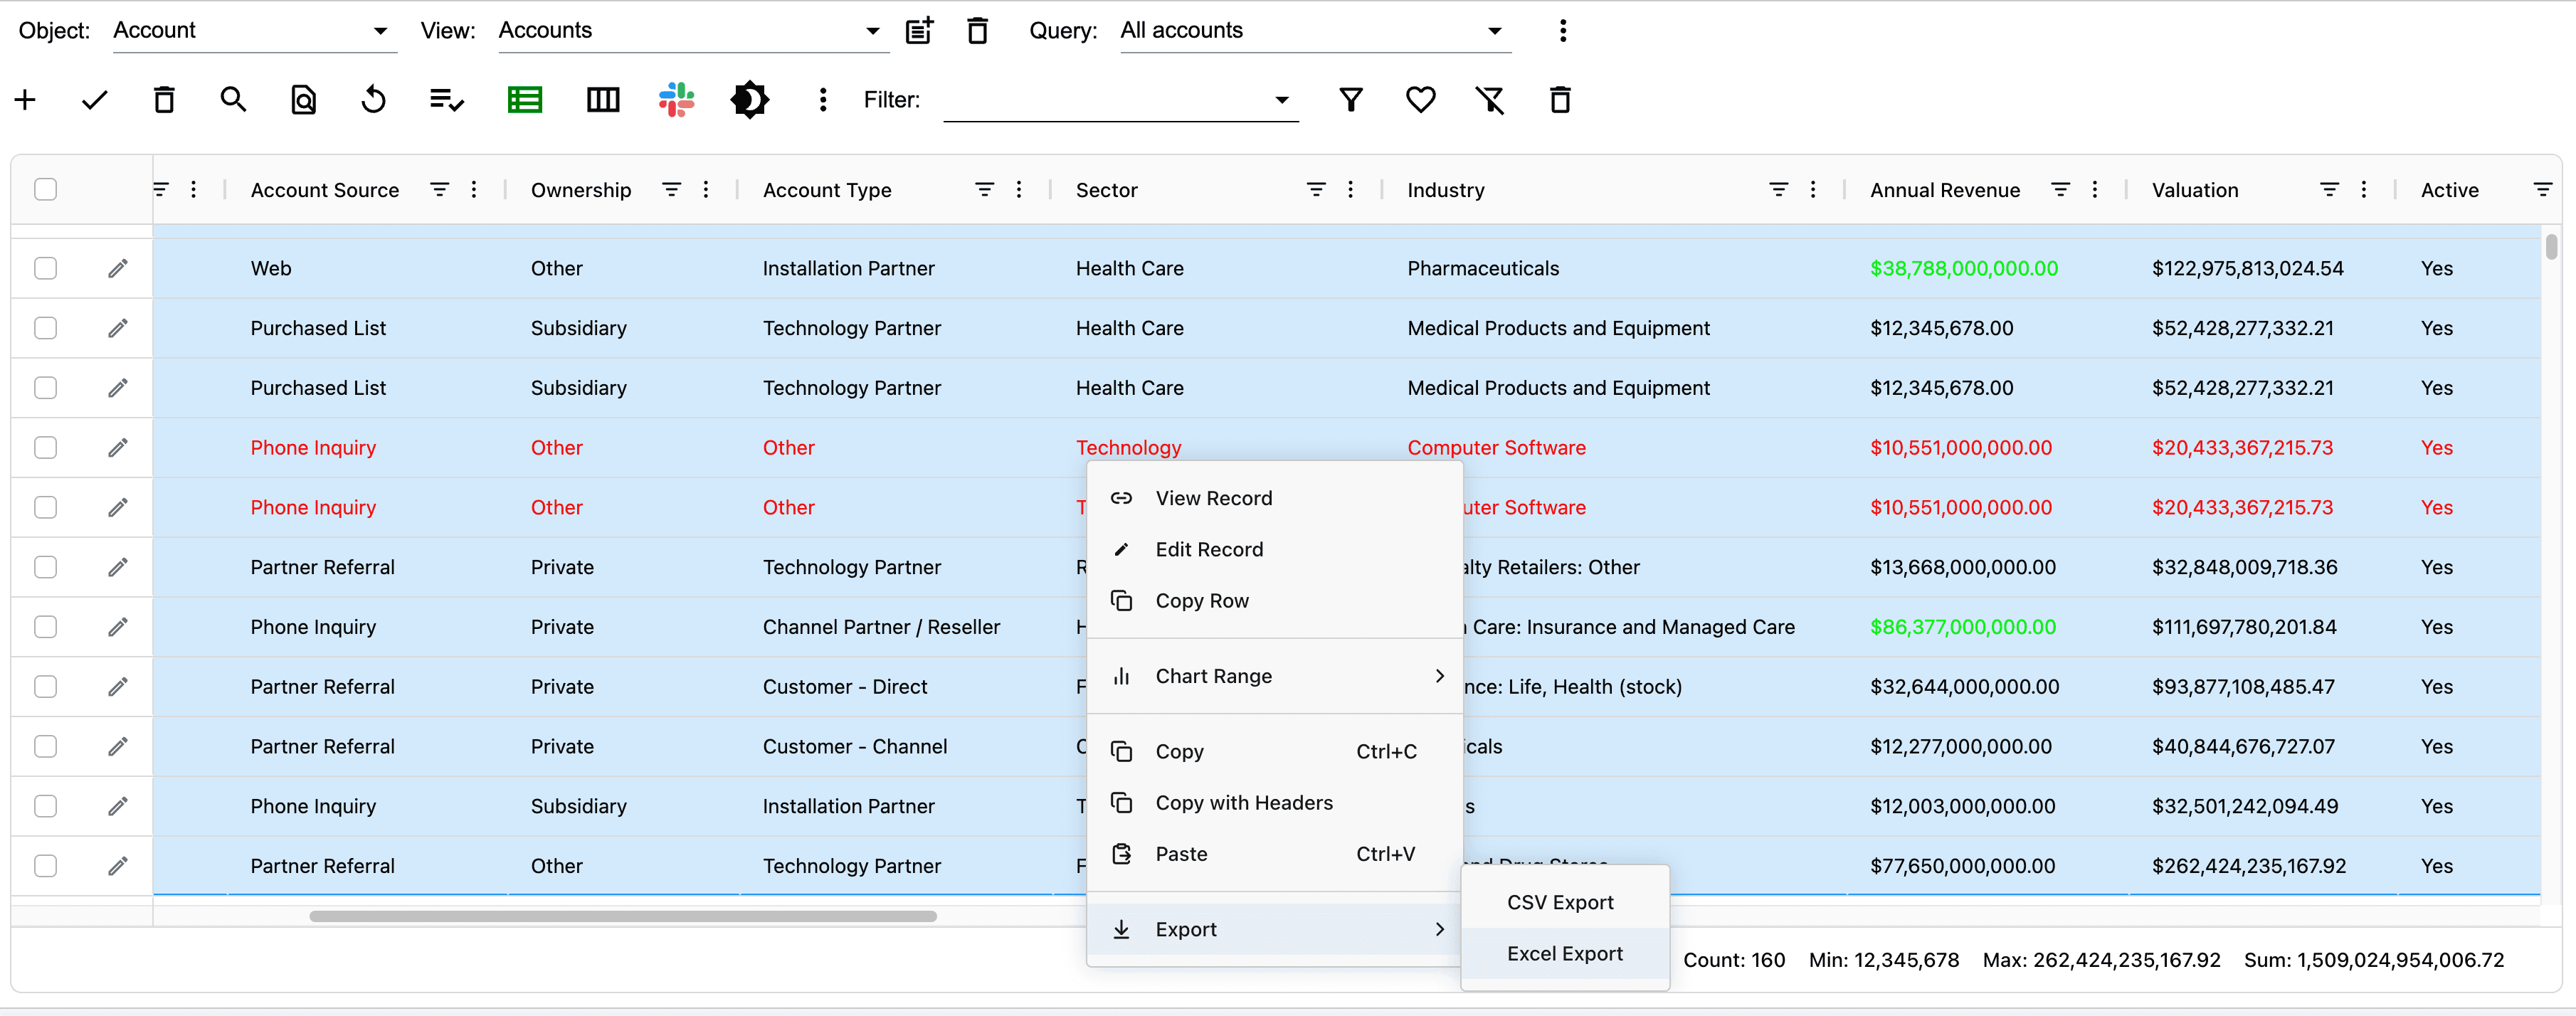
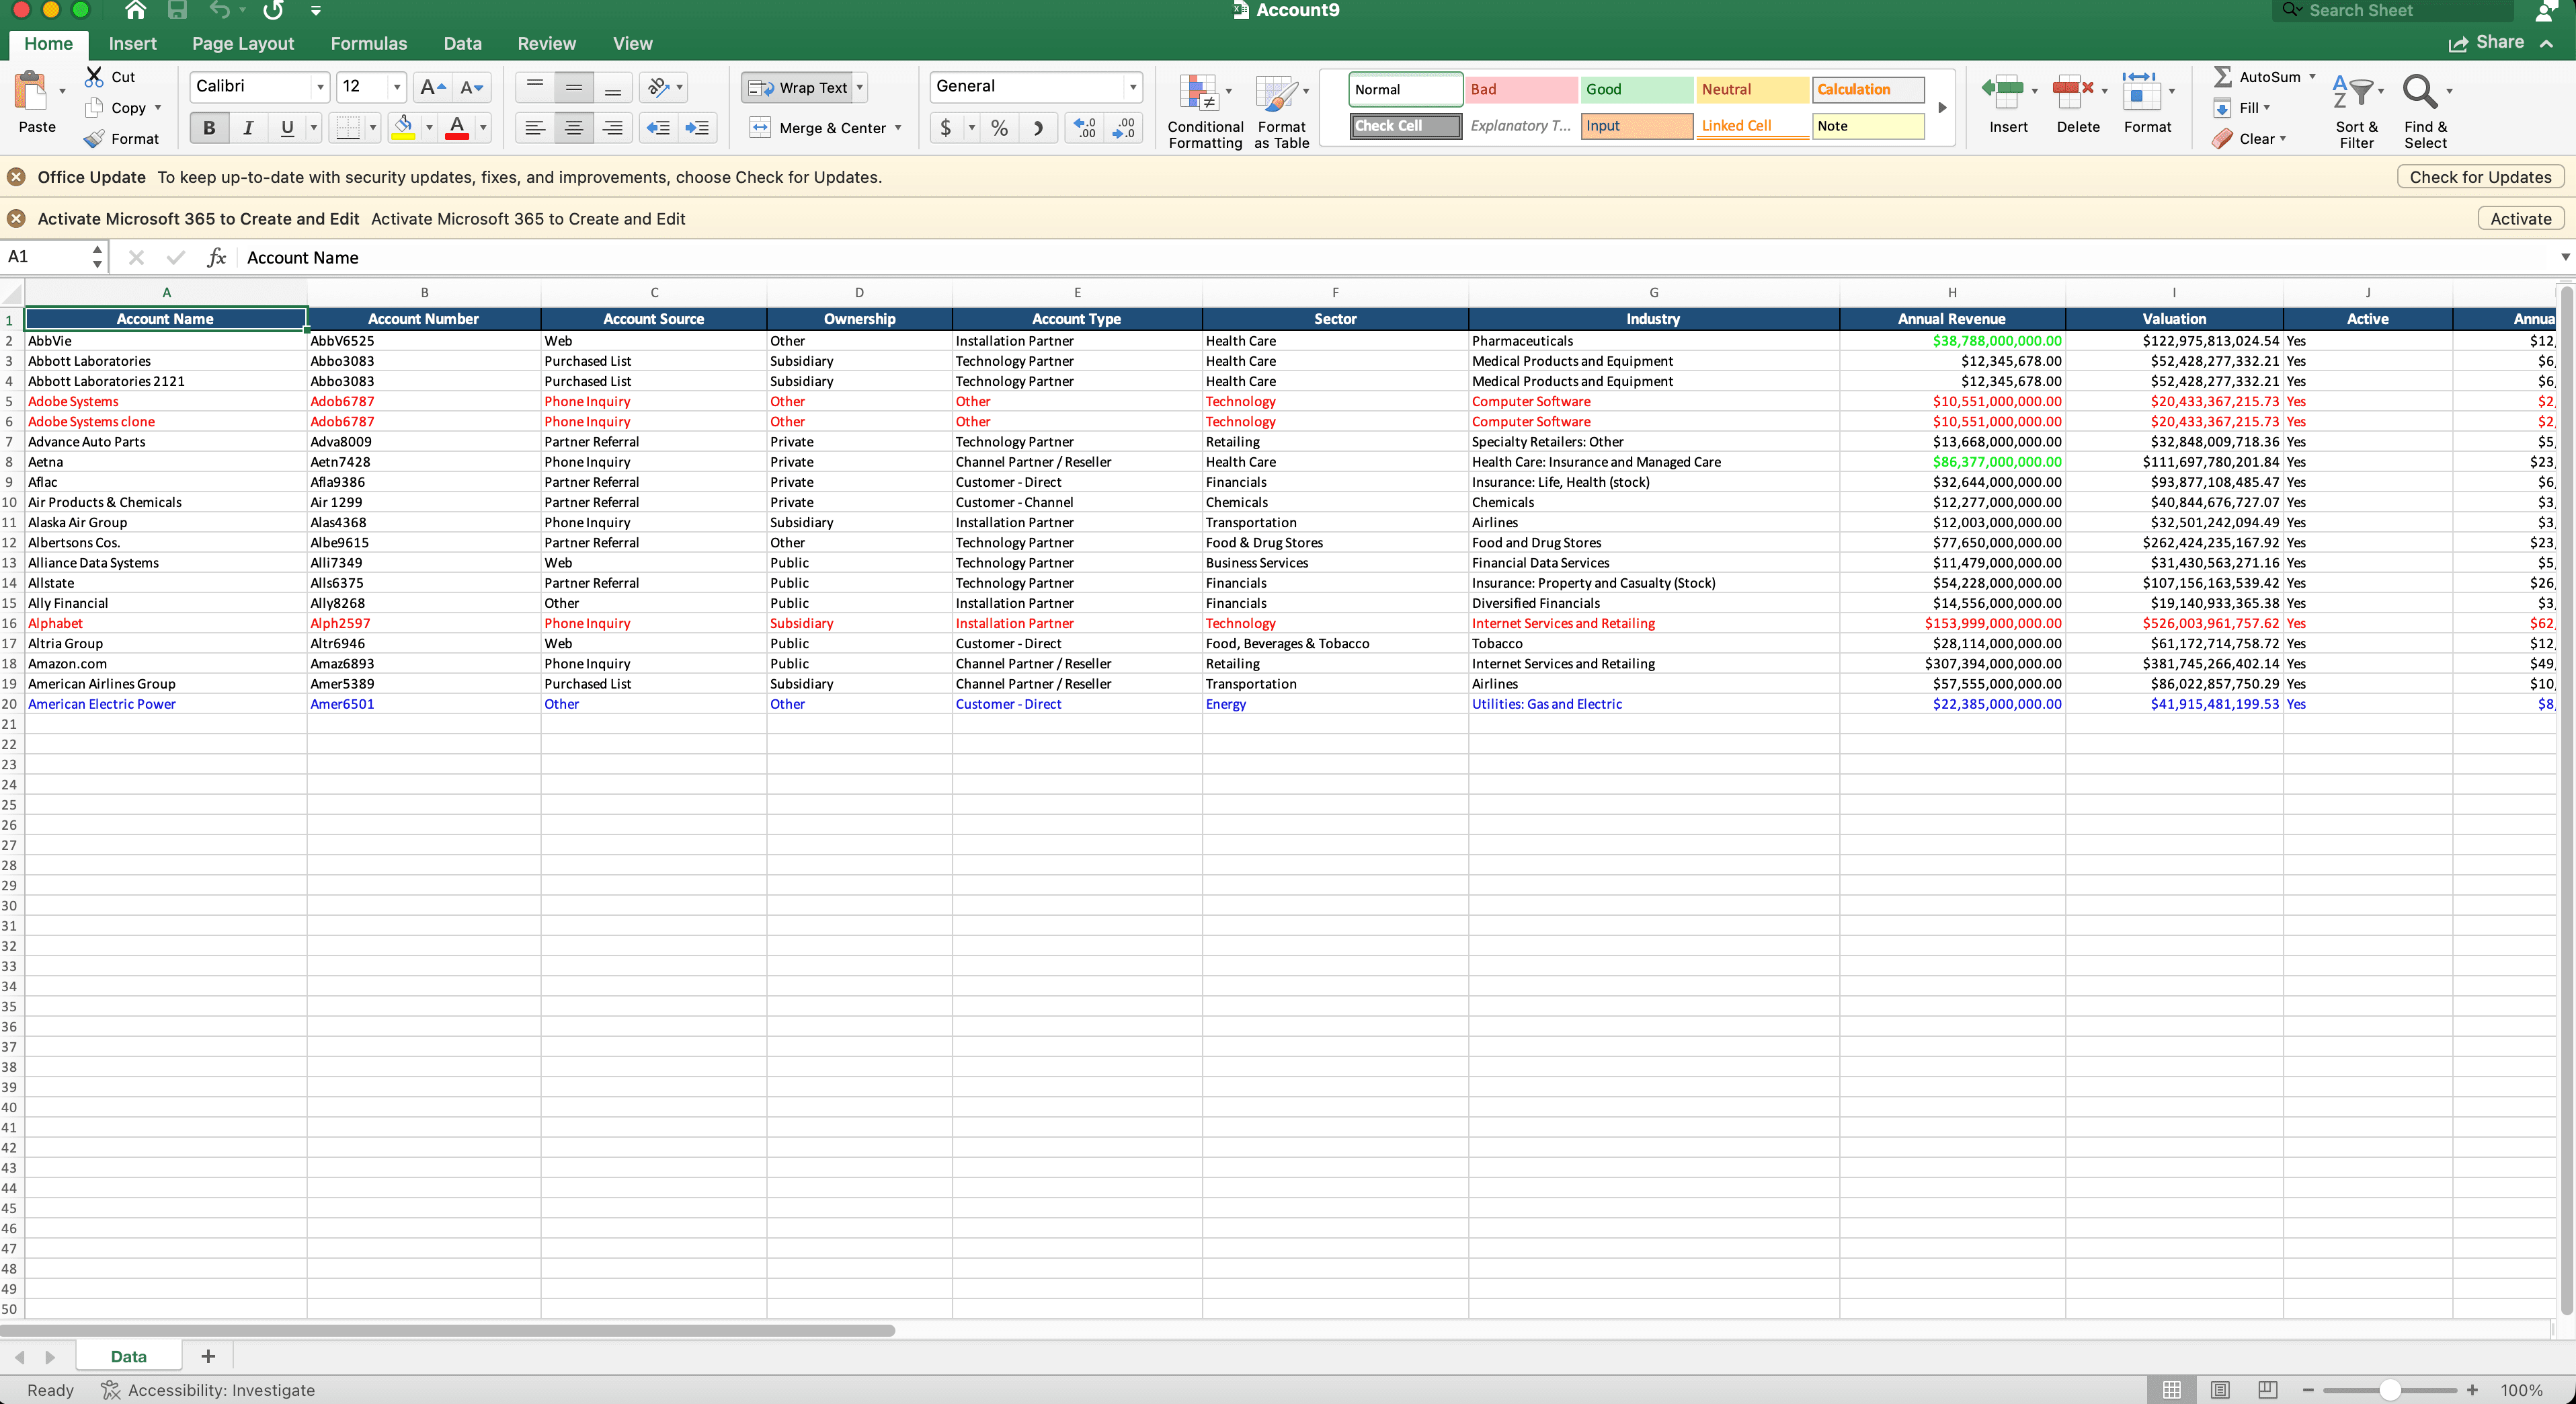
Once nice feature is that AppGrid will export the row and column styles to Excel.